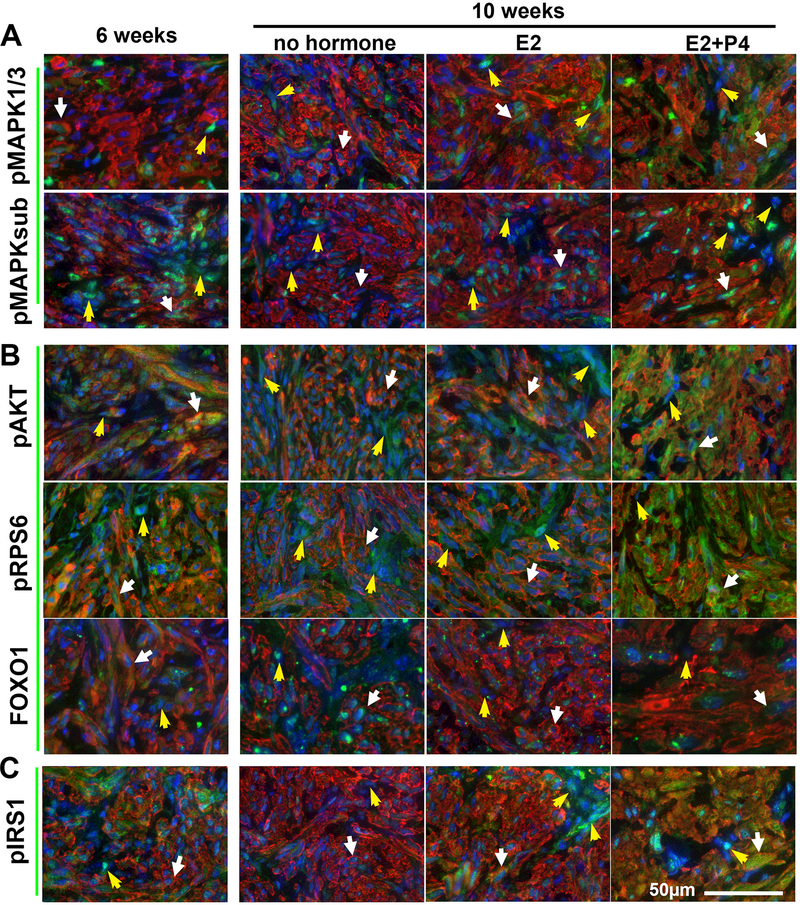
Figure 3. IF analysis on the regulation of signaling pathways by E2 and P4.
Following the treatment schedule indicated in Fig. 2A and sampled at the 6 and 10 week timepoints, MAPK, PI3K, and insulin/IGF pathway activities are detected by phosphorylation (p) of target proteins or localization of FOXO1. IF staining of (A) MAPK pathway: pMAPK1/3 and pMAPKsubstrate (B) PI3K pathway: pAKT, pRPS6, and FOX01 (C) Insulin/IGF pathway: pIRS1(green). In all images, SMCs are highlighted by ACTA2 (red) and nuclei are stained with Hochest (blue). White arrows, SMCs; yellow arrows, TAFs.

