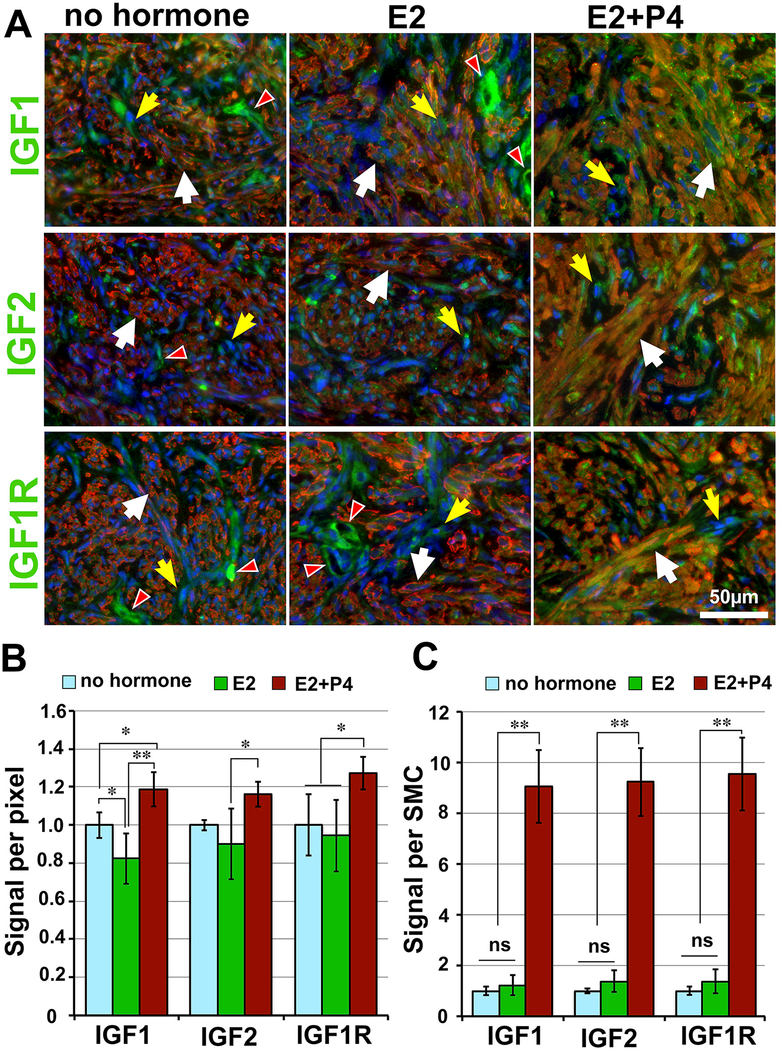
Figure 4. Tissue distribution of IGF pathway molecules.
(A) IF analysis of IGF1, IGF2 and IGF1R (green) in PDXs sample at 10 weeks time point with no hormone, E2 or E2+P4 treatment. In all color images SMCs are highlighted by ACTA2 (red) and nuclei are stained with Hochest (blue). White arrows, SMCs; yellow arrows, TAFs; and white arrowhead, vascular cells. Quantitative analysis of IF signals: the signal density (B) and the total protein level per SMC (C) were measured in PDXs of no hormone (N=5), E2 (N=4) and E2+P4 (N=6) groups. The statistical significance by Tukey’s HSD Test was indicated as; ns, non-significant; * P < 0.1; ** P < 0.05; and *** P < 0.01.

