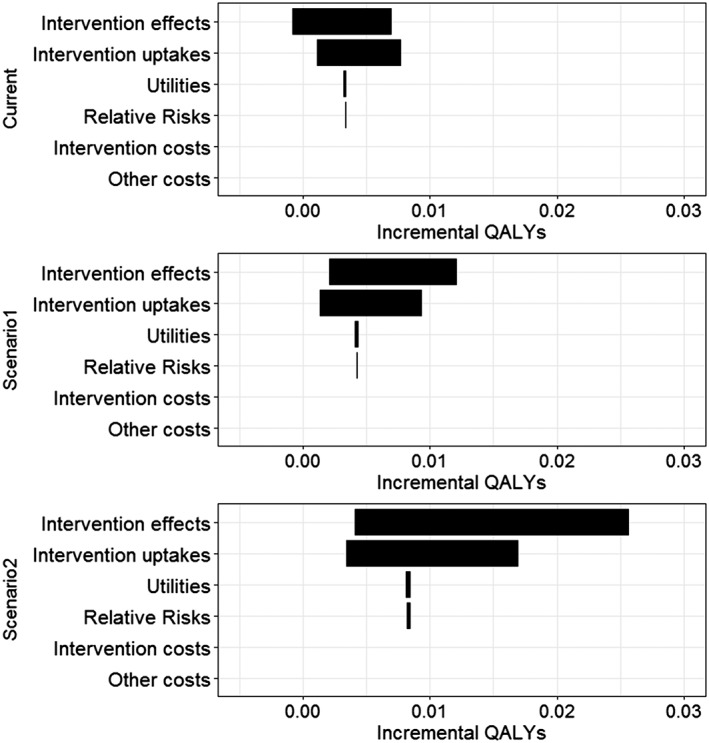
Figure 2.

Incremental quality‐of‐life years (QALYs) for current investment and prospective scenarios versus zero investment, univariate probabilistic sensitivity analyses for different selected groups. Note: In the tornado diagram, 95% confidence intervals are represented by the width of the horizontal bars
