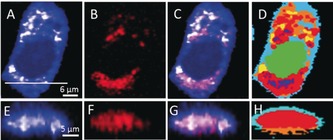
Figure 1.

Raman imaging of SK‐BR‐3 cells treated with 5 μm neratinib for 8 h. Raman images reconstructed from the C−H deformation (A) and C≡N stretching (B) intensities. C) Overlay of Panels A and B. E–G) Cross‐section Raman images of the same cell measured along the x–z axis. Scanning positions are indicated by the white line in Panel A. D,H) HCA results based on the Raman data shown in Panels A and E.
