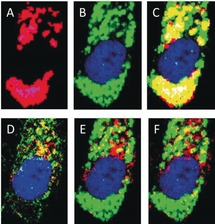
Figure 3.

A) HCA of neratinib‐containing clusters in the cell, B) fluorescence image of the same cell that shows lysosomes (green) surrounding the nucleus (blue), and C) overlay (yellow and white) of Panels A and B. D) Fluorescence image of the same cell that shows EGFR (red) and HER2 (green) distribution around the nucleus. The overlay (yellow) of Panel B with EGFR (red) and HER2 (red) is shown in Panels E and F, respectively.
