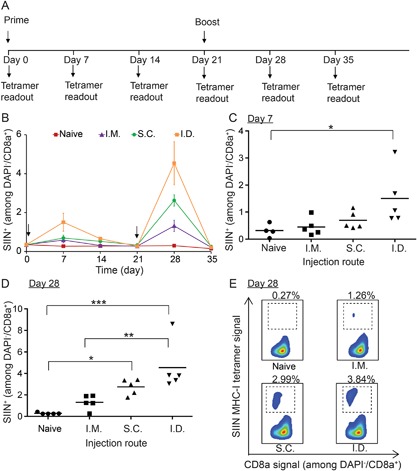
Figure 1.

Impact of injection route on expansion of SIIN‐specific CD8+ T cells. Three injection routes were employed: i.m., s.c., and i.d. (A) Schematic representation depicting experiment design and vaccination regimen. Mice were primed on day 0 and boosted on day 21. (B) Frequency of SIIN‐specific CD8+ T cells over 35 days. Statistical analysis of SIIN‐specific CD8+ T cell level in each group on (C) day 7 and (D) day 28. (E) Representative scatter plots showing distributions of SIIN‐specific and CD8+ T cells on day 28. In each group, the mice were injected with iPEMs composed of 65.6 µg SIIN* and 96.2 µg CpG. *P < 0.05; **P < 0.01; ***P < 0.001.
