
Figure 2.
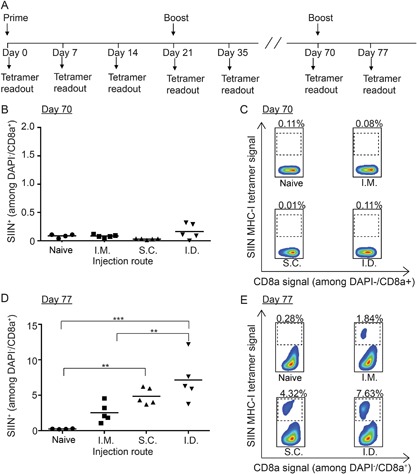
Durability of SIIN‐specific CD8+ T cells in mice immunized with iPEMs. (A) Schematic representation depicting experiment design and vaccination regimen. Mice were primed on day 0 and boosted on day 21 as in Figure 1, then boosted on day 70. Frequency (B, D) and representative flow cytometry scatter plots (C, E) of SIIN‐specific CD8+ T cells in peripheral blood of mice on day 70 (B, C) and day 77 (D, E). **P < 0.01; ***P < 0.001.