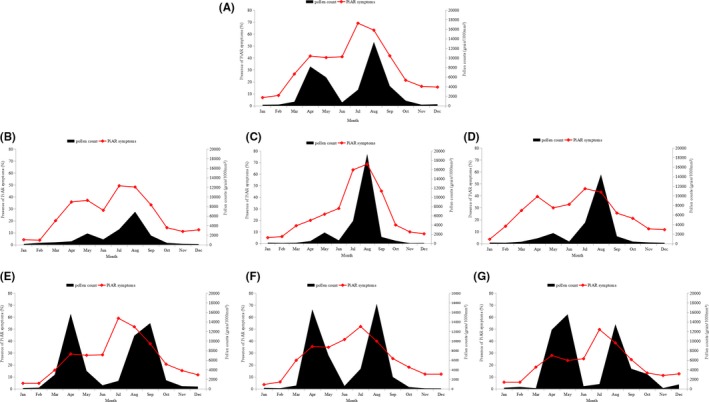
Figure 4.

The mean total monthly pollen count and presence of rhinitis symptoms for 12 mo (2015) in the six study areas. A, represents the overall data of the six study areas. B‐G, represents the data of the six individual areas. B Erenhot, C Xilinhot, D Duolun, E Jarud, F Kailu, G Tongliao
