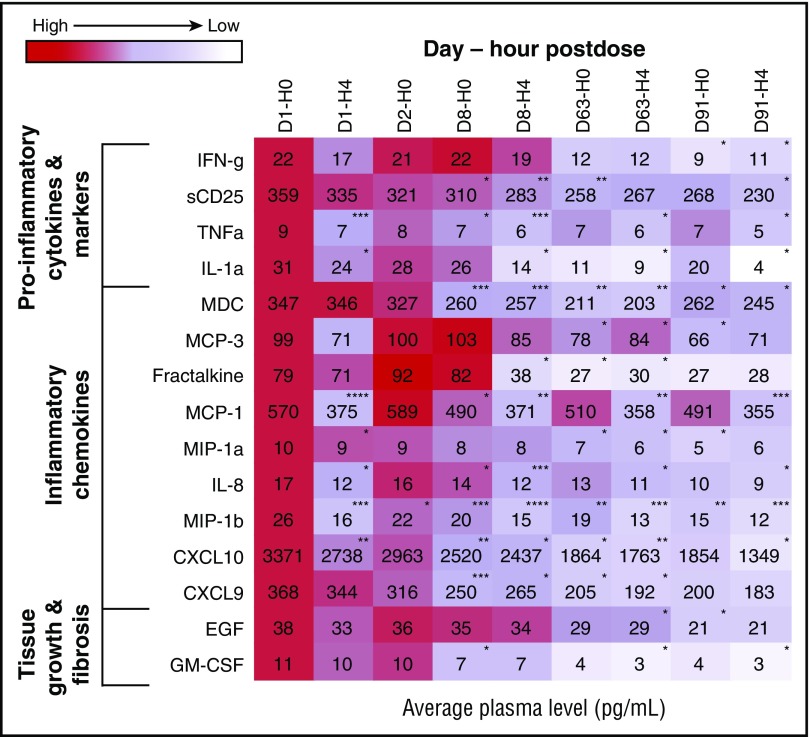
Figure 5.
Heat map of change in biomarker levels from baseline by time after ibrutinib dose. Heat map of chemokines, cytokines, or factors associated with fibrosis that showed a significant change in levels for at least 1 time point posttreatment. The values at each time point are expressed as a proportion of the baseline value and depicted as a heat map. *P < .05; **P < .01; ***P < .001; ****P < .0001. CXCL9, C-X-C motif chemokine ligand 9; CXCL10, C-X-C motif chemokine ligand 10; EGF, epidermal growth factor; GM-CSF, granulocyte-macrophage colony-stimulating factor; IFN-g, interferon-γ; IL-1a, interleukin-1α; IL-8, interleukin-8; MCP-1, monocyte chemotactic proteins 1; MCP-3, macrophage-derived chemokine, monocyte chemotactic proteins 3; MDC, macrophage-derived chemokine; MIP-1a, macrophage-inflammatory proteins 1α; MIP-1b, macrophage-inflammatory proteins 1β; sCD25, soluble CD25; TNFa, tumor necrosis factor-α.

