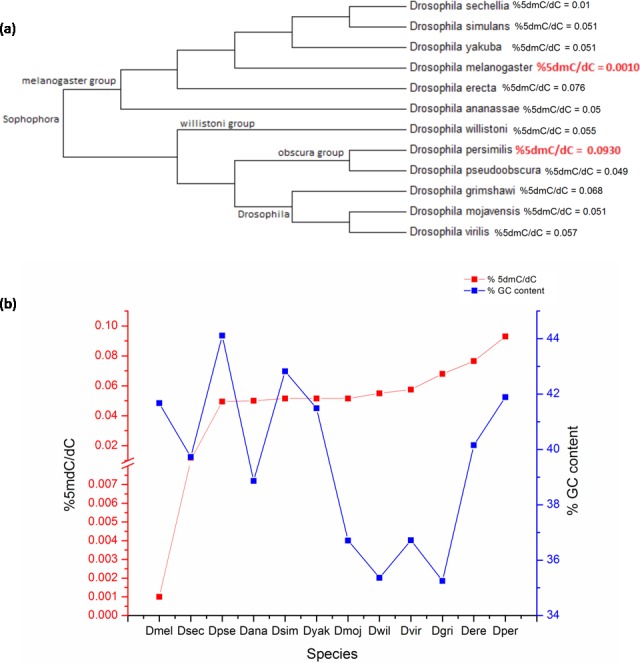
Figure 2. The percentage of 5mC nucleotides per cytosine nucleotides and the percentage of GC content in the genomes of members of Drosophila species.

(A) Phyogenetic relationship between the members of genus Drosophila. The two species with the highest and the lowest levels of 5mC are indicated in red. (B) The left Y-axis represents percentage of 5mC nucleotides per cytosine nucleotides counted and the right Y-axis represents the percentage of GC content of the genome; the X-axis represents D. melanogaster (Dmel), D. sechellia (Dsec), D. pseudoobscura (Dpse), D. ananassae (Dana), D. simulans (Dsim), D. yakuba (Dyak), D. mojavensis (Dmoj), D. willistoni (Dwil), D. virilis (Dvir), D. grimshawi (D.gri), D. erecta (Dere), D. persimilis (Dper). (< 0.05, p = 0.0217, KW test for comparison of means).
