
Figure 1. Descriptors of leukocyte cell infiltration in ovine interdigital skin epidermis.
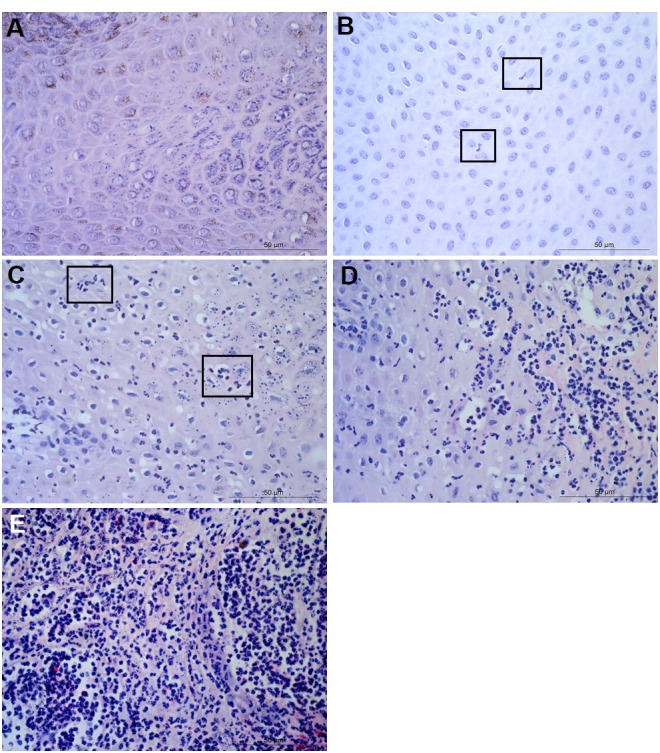
Haematoxylin and eosin stained epidermis photomicrographs showing no leukocytes in photomicrograph (A), occasional infiltration—single leukocytes visible within boxed areas (B), focal infiltration of leukocytes—visible in boxed areas (C), coalescing leukocytes—individual loci cannot be distinguished (D) and diffuse infiltration of leukocytes throughout the field of view (E). (A–E) represent inflammatory scores of 0–4 respectively, n = 55 healthy and 30 footrot. Scale bars represent 50 µm.