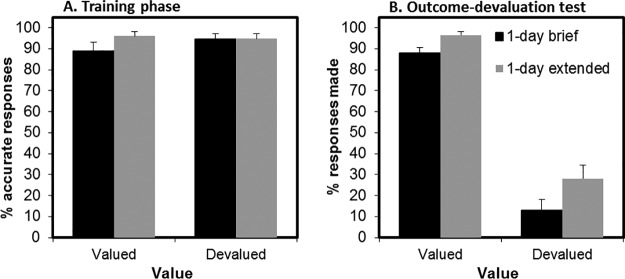
Figure 2.
Main results of Experiment 1A. Panel A: The brief (1-day) group received two trials of training per stimulus in total, whereas the extended (1-day) group received 33 trials per stimulus. Shown here are the average accurate response percentages for the final two stimulus presentations in both the 1-day brief (black bars) and 1-day extended training groups (gray bars). Panel B: The critical outcome-devaluation test results are shown in the right panel. Error bars represent standard error of the means.

