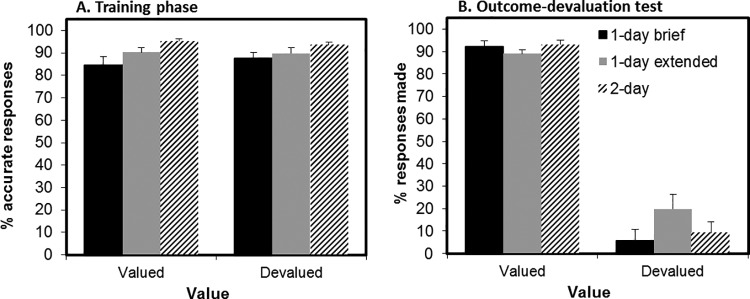
Figure 4.
Main results of Experiment 1B. Panel A shows response accuracy of the three groups (1-day brief: white bars; 1-day extended: gray bars; 2-day: black bars) separately for to-be-devalued and to-remain-valuable outcomes. Panel B: The percentage of responses for valued and devalued outcomes during the outcome-devaluation test is shown separately for the three groups. Error bars depict standard error of the means.

