Figure 5.

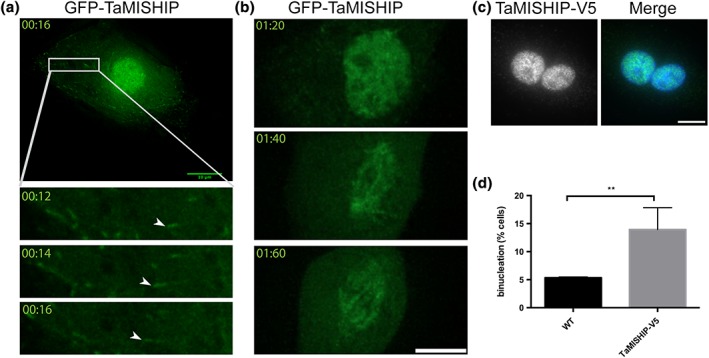
TaMISHIP localises to the nucleus, the mitotic spindle, and MT plus ends when overexpressed in non‐infected bovine macrophages. (a) Live cell imaging was performed with BoMac cells expressing GFP‐TaMISHIP, and pictures were taken every 2 s. The top panel shows a single time point from Movie S3. The region magnified in three subsequent time points (bottom panels) is indicated with a white rectangle. MT plus‐end tracking behaviour of GFP‐TaMISHIP is indicated with arrow heads. Scale bar = 5 μm. (b) Live cell imaging was performed with BoMac cells expressing GFP‐TaMISHIP, and pictures were taken every 10 min. The top panel shows a BoMac cell just prior to mitosis, when GFP‐TaMISHIP accumulates in the nucleus. The middle and bottom panels show the progression through mitosis, and the accumulation of GFP‐TaMISHIP on the mitotic spindle. The corresponding live cell imaging can be found in Movie S4. Scale bar = 5 μm. (c) TaMISHIP‐V5 was overexpressed in BoMac cells, and fixed cells were stained with anti‐V5 (green). DNA was labelled with DAPI (blue). Scale bar = 10 μm. (d) BoMac cells were transfected with TaMISHIP‐V5 and fixed 24 hr after transfection. Binucleation was counted in nontransfected and transfected cells. Shown is the mean relative number of binucleated cells in three independent experiments (n = 131, 90, 89; p = .0031)
