
Figure 1.
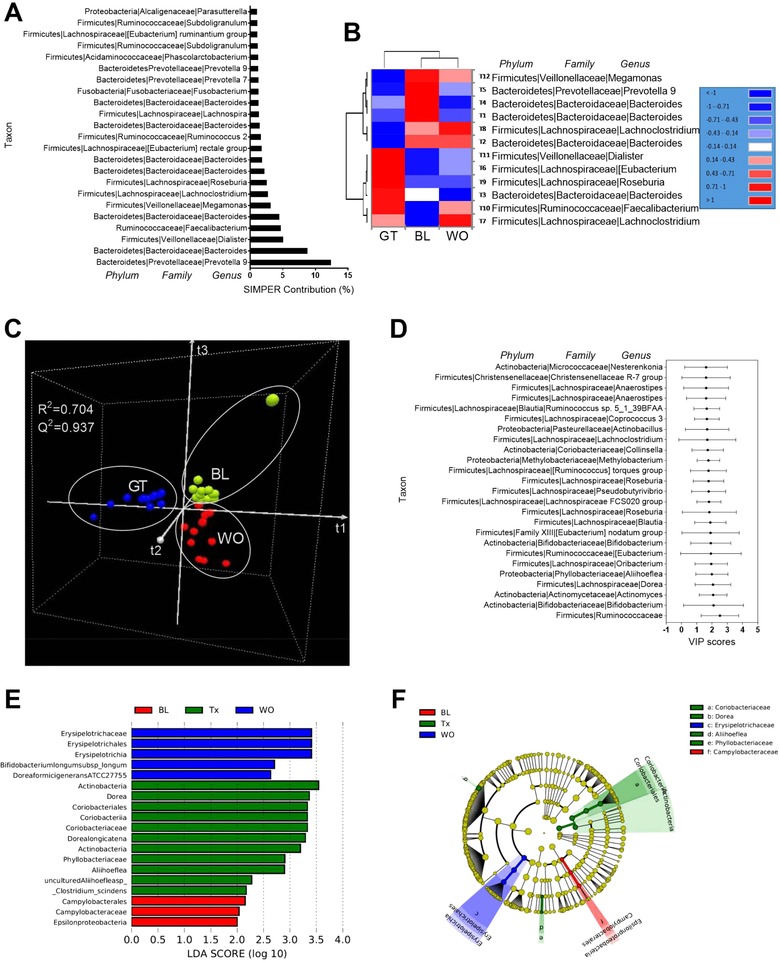
Green tea liquid consumption alters the overall gut microbiota composition. A) Similarity percentage (SIMPER) analysis using Bray–Curtis dissimilarity index showing the top 23 taxa with the greatest contribution (>1%) to the differences observed between 3 time points. B) Hierarchical clustering (HCN) with a heat map shows the relative abundances of core microbiota (relative abundance >1.0% and shared taxa among three time points). C) 3D view of score plots showing the results of supervised partial least squares‐discriminant analysis (PLS‐DA) with model fitness parameters of R 2(cum) = 0.937 and Q 2(cum) = 0.704, respectively. D) The top 25 taxa with variable importance in projection (VIP) scores (between 1.6 and 2.5) possibly responsible for discrimination of the GTL from BL and WO samples. The scores are given with upper bound (95%) and lower bound (95%). E) Linear discriminant analysis (LDA) scores (log 10) derived from LEfSe analysis, showing the biomarker taxa (LDA score of >2 and a significance of p <0.05 determined by the Wilcoxon signed‐rank test) for BL and Tx (GT) and WO. F) Cladogram generated from LEfSe analysis showing the relationship between taxon (the levels represent, from the inner to outer rings, phylum, class, order, family, and genus). Taxa are shown as phylum, family, and genus in (A), (B), and (D).