
Figure 4.
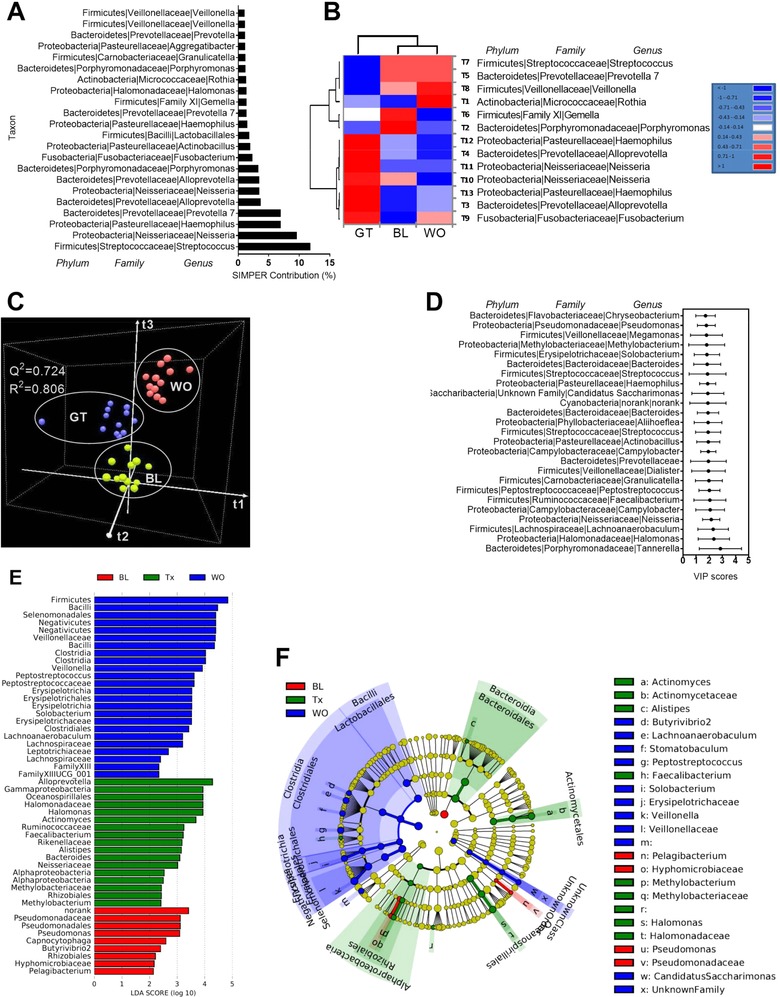
Green tea liquid consumption alters the overall salivary microbiota composition. A) Similarity percentage (SIMPER) analysis. B) Hierarchical clustering (HCN) with a heat map shows the relative abundances of core microbiota. C) 3D view of score plots showing the results of supervised PLS‐DA with model fitness parameters. D) The top 25 taxa with VIP scores (between 1.7 and 2.8) possibly responsible for discrimination of the GT from BL and WO samples. The scores are given with upper bound (95%) and lower bound (95%). E) LDA scores (log 10) derived from LEfSe analysis, showing the biomarker taxa for BL, Tx (GT) and WO. F) Cladogram generated from LEfSe analysis showing the relationship between taxon. LEfSe, LDA effect size.