
Figure 3.
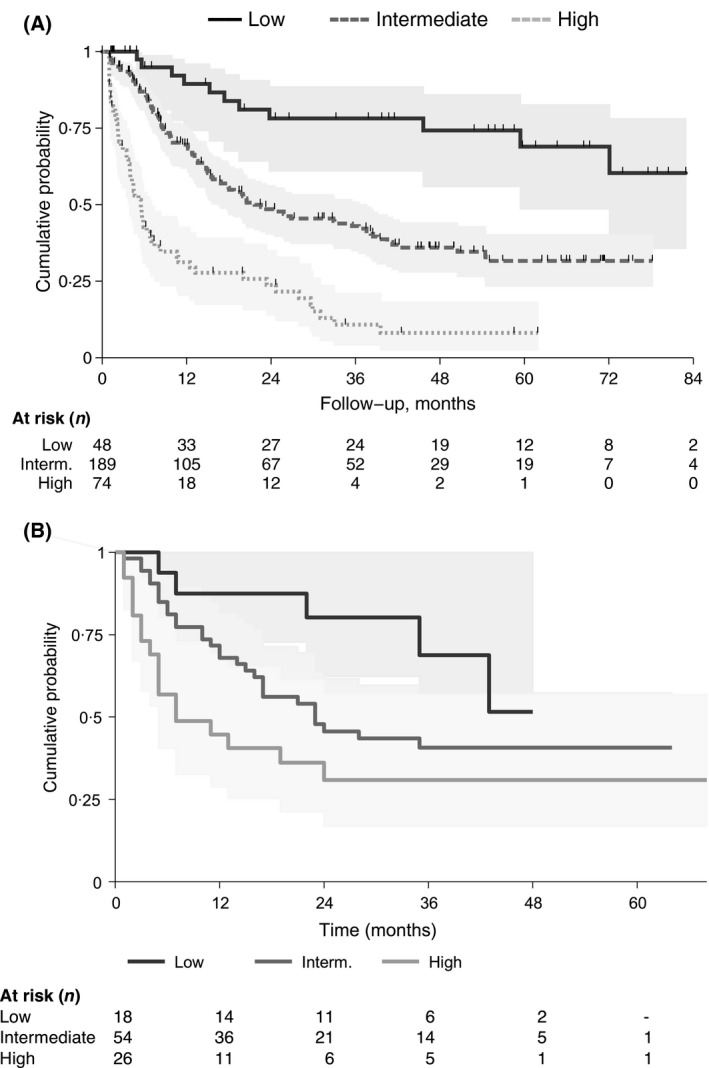
Kaplan–Meier curves of overall survival by risk groups identified by the model in the training sample (n = 311) (Panel A) and in the validation sample (n = 98) (Panel B). Interm., intermediate.
Official websites use .gov
A
.gov website belongs to an official
government organization in the United States.
Secure .gov websites use HTTPS
A lock (
) or https:// means you've safely
connected to the .gov website. Share sensitive
information only on official, secure websites.
Kaplan–Meier curves of overall survival by risk groups identified by the model in the training sample (n = 311) (Panel A) and in the validation sample (n = 98) (Panel B). Interm., intermediate.