Figure 1.
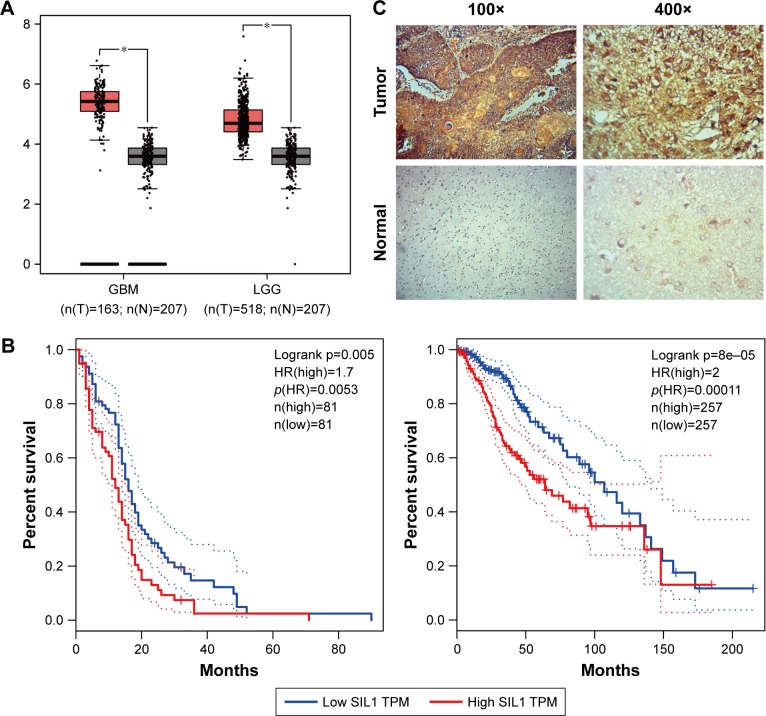
SIL1 was highly expressed in glioma and represented a poor prognosis. (A) The red and gray boxes represent glioma and normal tissues, respectively. The y-axis indicates the log2-transformed gene expression level. (B) Survival percentage of glioma patients with high or low SIL1 expression. Left: GBM; right: LGG. The data of (A) and (B) were obtained with permission from,Tang Z, et al. (2017) GEPIA: a web server for cancer and normal gene expression profiling and interactive analyses. Nucleic Acids Res. 10.1093/nar/gkx247.15 (C) Endogenous levels of SIL1 in glioma and paracarcinoma tissues were tested by immunohistochemical assay.
Note: *P<0.05.
Abbreviations: GBM, glioblastoma multiforme; GEPIA, Gene Expression Profiling Interactive Analysis; LGG, lower grade glioma; TCGA, The Cancer Genome Atlas; HR, hazards ratio; TPM, trans per million.

