Figure 3.

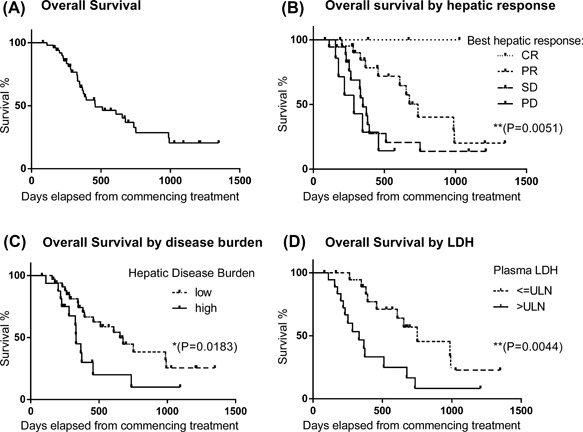
Kaplan‐Meier plots of overall survival of UM patients treated with M‐PHP. (A) Curve for entire group. (B‐D) Curves stratified by best response to M‐PHP (B), disease burden at baseline (C) and serum LDH (D)

Kaplan‐Meier plots of overall survival of UM patients treated with M‐PHP. (A) Curve for entire group. (B‐D) Curves stratified by best response to M‐PHP (B), disease burden at baseline (C) and serum LDH (D)