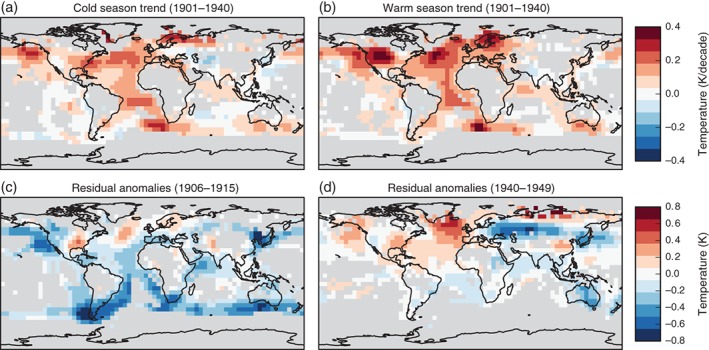
Figure 2.

Spatial maps showing decadal temperature trends for boreal cold (a, November–March) and warm season (b, April–October) for the early 20th century (1901–1940) in HadCRUT4 (Morice et al., 2012). (c, d) Spatial temperature anomalies from HadCRUT4 after the multimodel mean CMIP5 response to all historical forcings combined has been subtracted based on analysis discussed below. All panels are masked where coverage is too sparse (gray); in panels (a) and (b) where coverage in either the first or second half of the period drops below 30%; in panels (c) and (d) where coverage in any season drops below 30% in either the first or second half of the decade. For details see Supporting information
