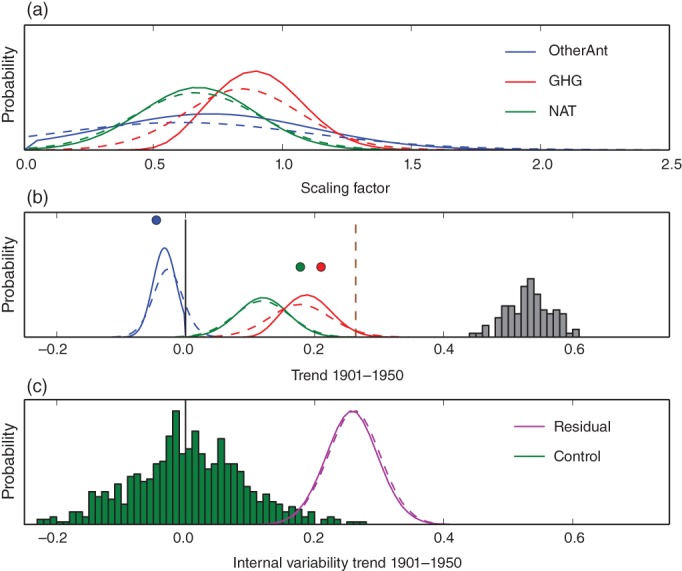
Figure 5.

Top panel: Scaling factors, that is, magnitude of model fingerprint consistent with observations for the response to greenhouse gases (red), other anthropogenic factors (blue) and natural factors (solar and volcanic, green) from an analysis of decadal temperatures over 1862–2012. This translates into an estimated contribution to warming 1901–1950 by increases in greenhouse gases, natural forcings, and other anthropogenic forcings compared to the ensemble of HadCRUT observed warming accounting for uncertainty (gray histogram) shown in the middle panel. Dots: Multimodel unscaled best estimate of contribution by forcing. pdfs: Estimated contribution from attribution analysis allowing for up‐ or down‐scaling as long as consistent with observations. Dashed line: Trend from a proxy reconstruction (Crowley et al., 2014). Bottom panel: Residual warming not explained by forcing (purple pdf) compared to CMIP5 control run trends over 50 years to estimate internal variability (green). All analysis is done with model data masked to replicate the data coverage of observed data, and merging sea surface temperature with air temperature over land (Cowtan et al., 2015), solid lines show results using an informative prior, dashed lines an uninformative prior. After Schurer et al., 2018
