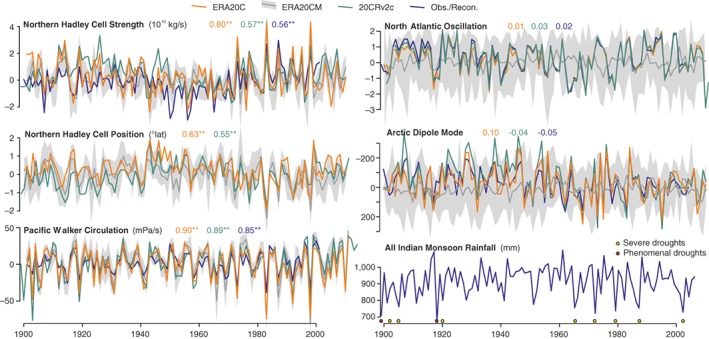
Figure 7.

Annual time series of circulation indices, expressed as anomalies from 1961 to 1990. Shown are series from two reanalyses (20CRv2c, ERA20C), the atmospheric model simulations ERA20CM (10 members; ensemble mean and spread are indicated (Hersbach et al., 2015) and series based on observations or reconstructions. Shown are the seasonal mean strength of the boreal Hadley cell (the maximum of the meridional mass stream function), its latitudinal position (latitude of the maximum), the Pacific Walker cell (difference in 500 hPa ω between the areas [10°S–10°N, 180–100°W] and [10°S–10°N, 100–150°E]), the North Atlantic oscillation (NAO) and the Arctic dipole mode (here defined as the SLP difference north of 60°N between the western and the eastern hemisphere; after Brönnimann et al. (2009) and Brönnimann et al. (2009). Additionally, a statistical reconstruction of the Pacific Walker cell is shown (Brönnimann, Stickler, Griesser, Ewen, et al., 2009; Brönnimann, Stickler, Griesser, Fischer, et al., 2009) and an observation‐based NAO index based on HadSLP2p data (Allan & Ansell, 2006). All series are for December–February except Hadley cell position (January–December) and Indian summer monsoon rainfall (June–August, Sontakke et al., 2008). Colored numbers indicate correlations between the correspondingly colored reanalyses or observations with the ERA20CM ensemble mean (* and ** denote 95 and 99% significance). The purple line for Indian summer monsoon rainfall is based on a reconstruction (Zhou et al., 2010). Severe and phenomenal droughts (Wang, 2006) over India are added as circles
