
Figure 10.
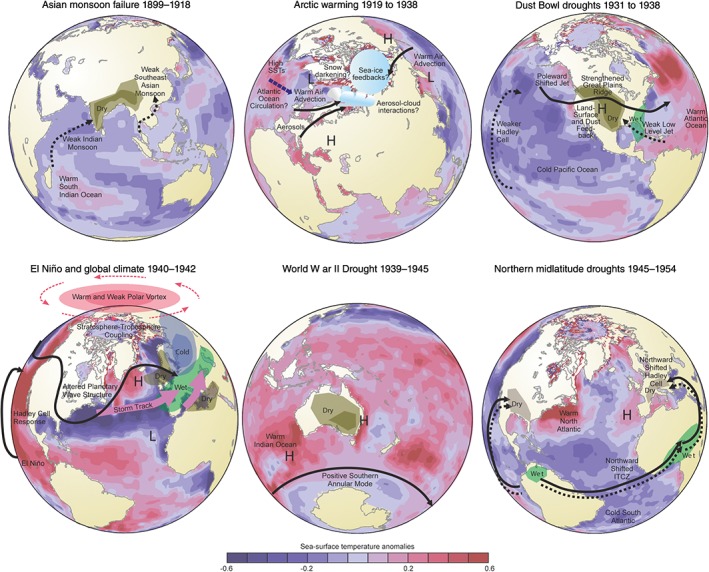
Schematic figure of six climatic anomalies during the ETCW. SST anomalies from HadSST1.1, given as annual mean over indicated period relative to the average of the preceding 15 and following 15 years. Mechanisms discussed in the text are shown schematically