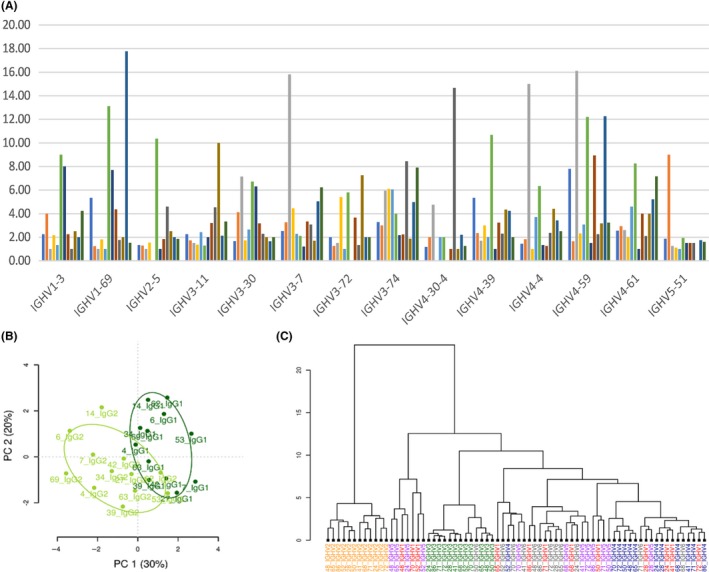
Figure 2.

Ig gene repertoire variation between individuals, classes of antibody, and IGHV gene families. (a) Individual variability in a human vaccine response. Average clonality of selected IGHV genes in the repertoire of 12 individuals (each is color coded) at day 7 after challenge with influenza and pneumococcal vaccines.156 Average clonality is the number of sequences divided by the number of clonal families for each individual genes. Average clonality of 1 indicates lack of clonal expansion. (b) PCA analysis of CDR3 physicochemical properties, as defined by kidera factors, showing the difference between Ig genes of IgG1 vs IgG2 subclasses. Data from Martin et al73 (c) Segregation of IGHV family genes by CDR‐H3 physicochemical properties. Minkowsky distance clustering by Brepertoire146 on IgM sequences from B cells in early development in 12 different individuals.76 Each sample is a separate individual. IGHV genes color coded: Yellow; IGHV2, Red;IGHV1, Green; IGHV3, Blue; IGHV4, Violet; IGHV5, Gray; IGHV6
