
Figure 1.
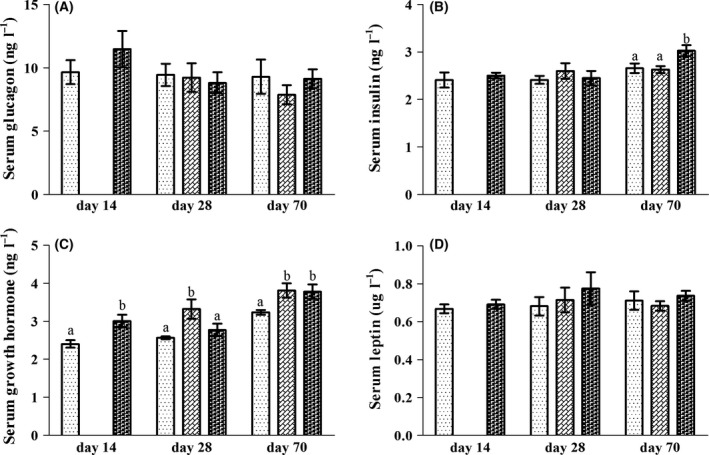
The serum concentrations of glucagon (A), insulin (B), growth hormone (C) and leptin (D) of rats in L ( ), LN (
 ) and N (
 ) groups on day 14, day 28 and day 70. Values are presented as the mean ± SEM. Different letters among groups on the same day indicate a significant difference, P < 0.05.