
Figure 3.
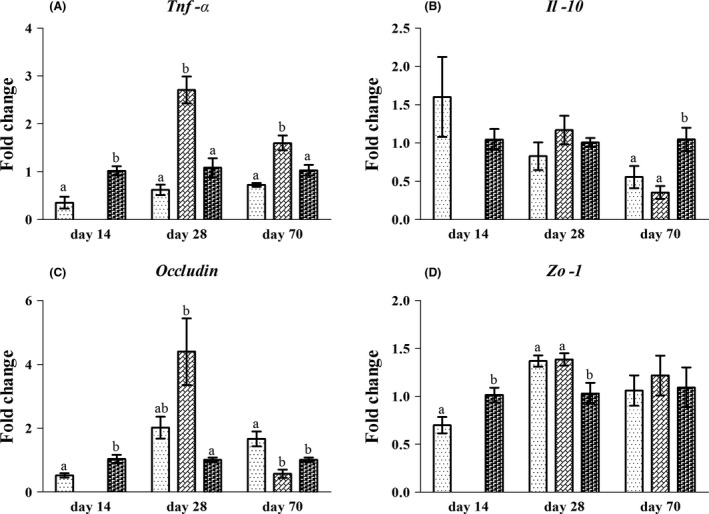
The gene expression of inflammatory cytokines (A–B) and tight junction proteins (C–D) in the jejunal mucosa of rats in the L ( ), LN (
 ) and N (
 ) groups on day 14, day 28 and day 70. Values are presented as the mean ± SEM (n = 6). Different letters among groups on the same day indicate a significant difference, P < 0.05.