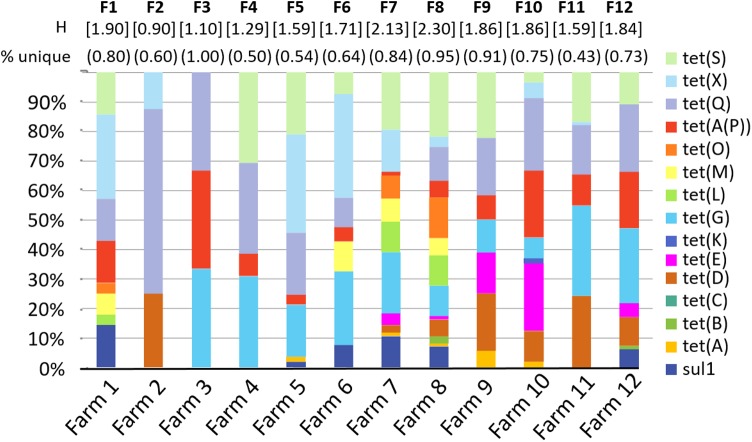
FIGURE 2.
Diversity of selected antibiotic resistance genes by farm. Graph shows the percent of samples from each farm that were positive for each gene. “Percent unique” indicates the number of sample ARG profiles that are unique for each farm. For example, in farm 1, 8 of the 10 profiles were unique = 0.80. H is the Shannon diversity index for each farm. “F1–F12” indicates farms 1–12.

