Fig. 1.

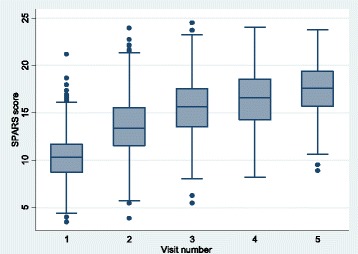
Overall SPARS scores by visit during the first year, indicating median (middle line), percentiles (25th and 75th shaded area, 5th and 95th outer lines), and extreme values

Overall SPARS scores by visit during the first year, indicating median (middle line), percentiles (25th and 75th shaded area, 5th and 95th outer lines), and extreme values