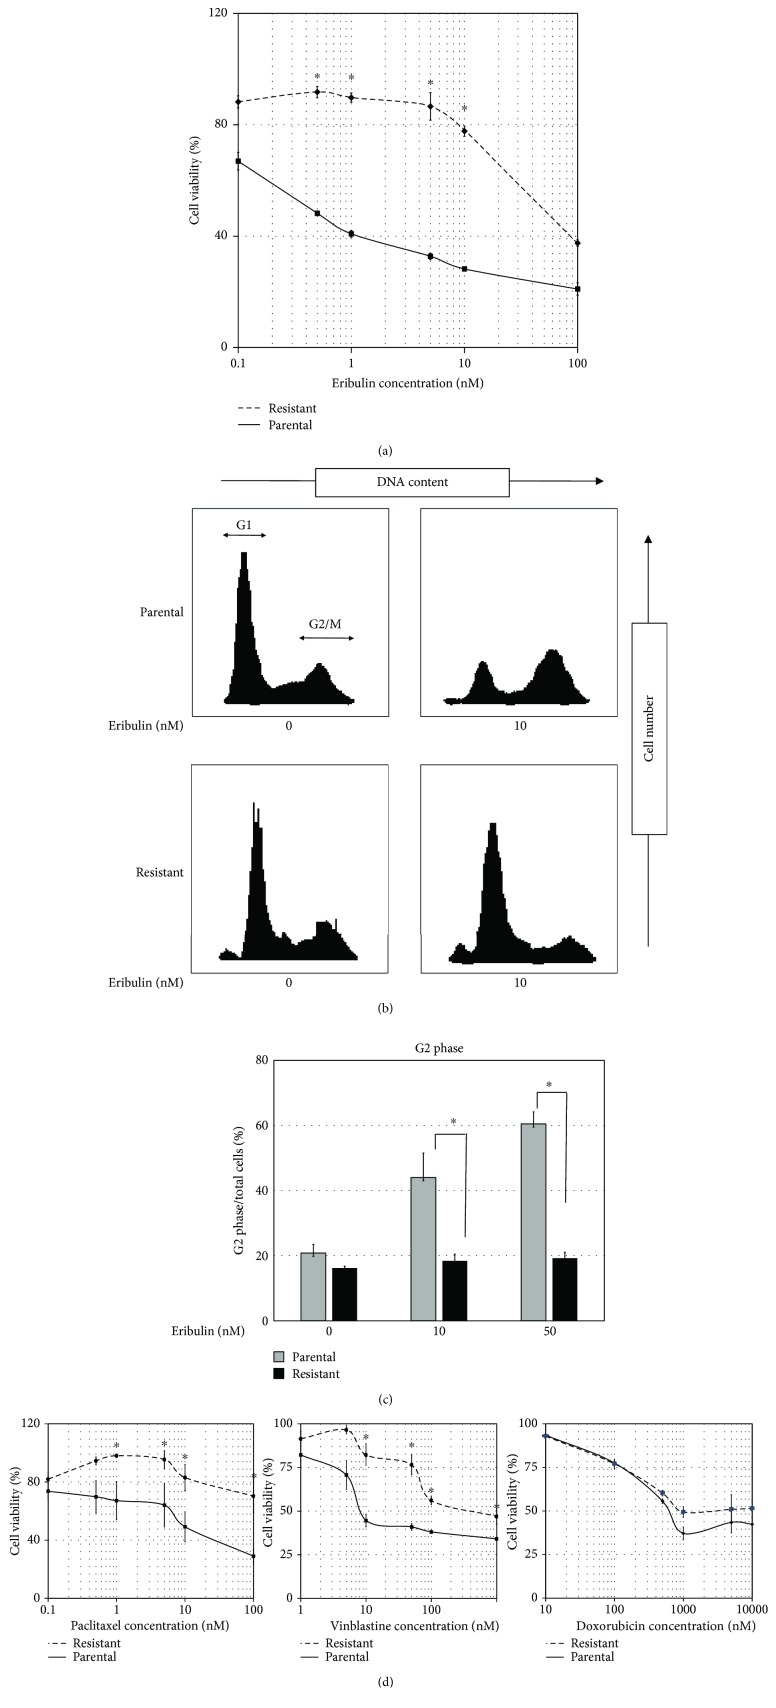
Figure 1.
Drug sensitivity and cell cycle analysis of parental and eribulin-resistant cell lines. (a) The leiomyosarcoma cell line was incubated with various doses of eribulin for 48 hours. The solid line represents the parental cell line, and the dotted line represents the eribulin-resistant cell line. Viable cells were measured using CellTiter-Glo. Values represent mean ± SD. ∗ P < 0.05, versus parental cell line. (b, c) Cells were incubated with eribulin (0 nM, 10 nM, or 50 nM) for 12 hours and fixed with 70% ethanol. The DNA content of each phase was analyzed by flow cytometry after staining with PI, and the percentage of cells in G2 phase was calculated. Values represent mean ± SD. ∗ P < 0.05, versus parental cell line. (d) The leiomyosarcoma cell line was also incubated with various doses of paclitaxel (left panel), vinblastine (middle panel), and doxorubicin (right panel). The solid line represents the parental cell line, and the dotted line represents the eribulin-resistant cell line. Viable cells were measured using CellTiter-Glo. Values represent mean ± SD. ∗ P < 0.05, versus parental cell line.

