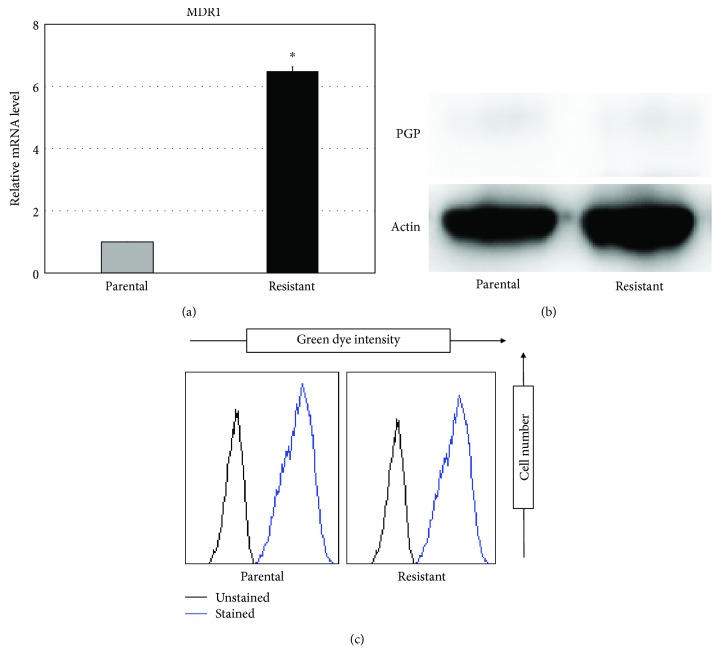
Figure 2.
Expression and functional analysis of MDR1. (a, b) The expression of TUBB3 was investigated by real-time quantitative PCR and Western blotting in each cell line. Values represent mean ± SD. ∗ P < 0.05, versus parental cell line. (c) Functional activity of MDR1 was analyzed by EFLUXX-ID Green Multidrug Resistance Assay. The left black curve shows unstained cells as a negative control. The right blue curve shows cells stained with EFLUXX-ID Green.

