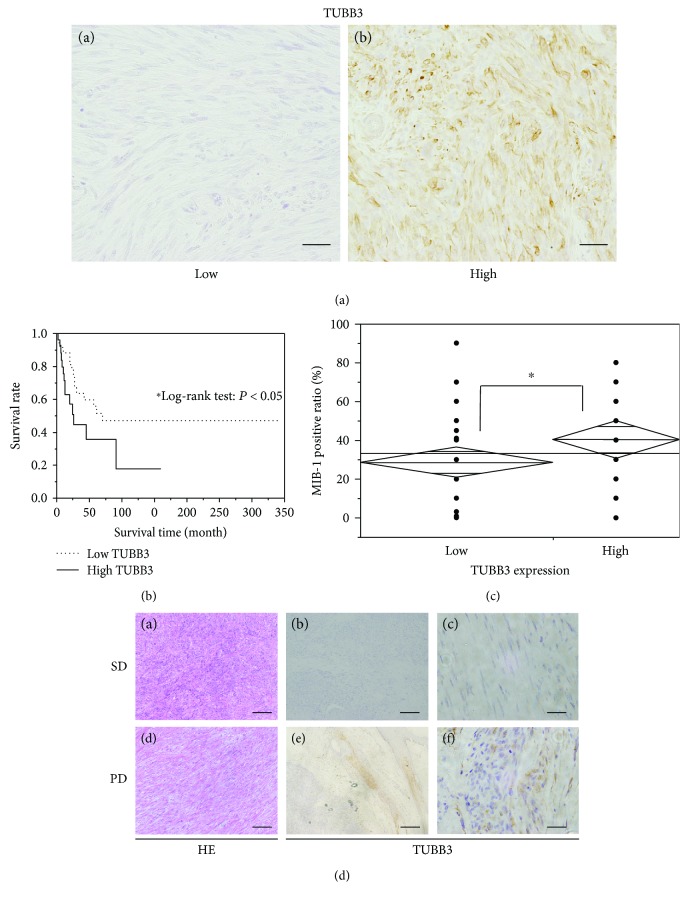
Figure 4.
Expression of TUBB3 in clinical leiomyosarcoma samples. (a) Immunohistochemical staining of TUBB3 in 68 clinical samples from patients with leiomyosarcoma. (A, B) the representative samples of immunohistochemical staining of TUBB3: (A) low TUBB3 expression and (B) high TUBB3 expression. Scale bar represents 100 μm in (A) and (B). (b) Overall survival analysis of the patients with leiomyosarcoma which express high or low TUBB3 by the Kaplan-Meier method. The solid line represents high TUBB3 group, and the dotted line represents low TUBB3 group. ∗ P < 0.05. (c) Analysis of TUBB3 expression and MIB-1 positive ratio (%). The high TUBB3 group exhibited a significantly higher MIB-1 positive ratio than did the low TUBB3 group. ∗ P < 0.05. (d) HE and immunohistochemical staining of TUBB3 in tumor biopsies from patients who were treated with eribulin. (A, B, C) Upper specimens represent the tissue samples from the patient who continued to have stable disease (SD) 12 weeks after initial treatment with eribulin. (D, E, F) Lower specimens represent the tissue samples from the patient who resulted in progressive disease (PD) after treatment with eribulin. (A, D) Staining with hematoxylin and eosin. (B, C, E, F) Immunohistochemical staining of TUBB3. Scale bar represents 100 μm in (A) and (D), 200 μm in (B) and (E), and 20 μm in (C) and (F).

