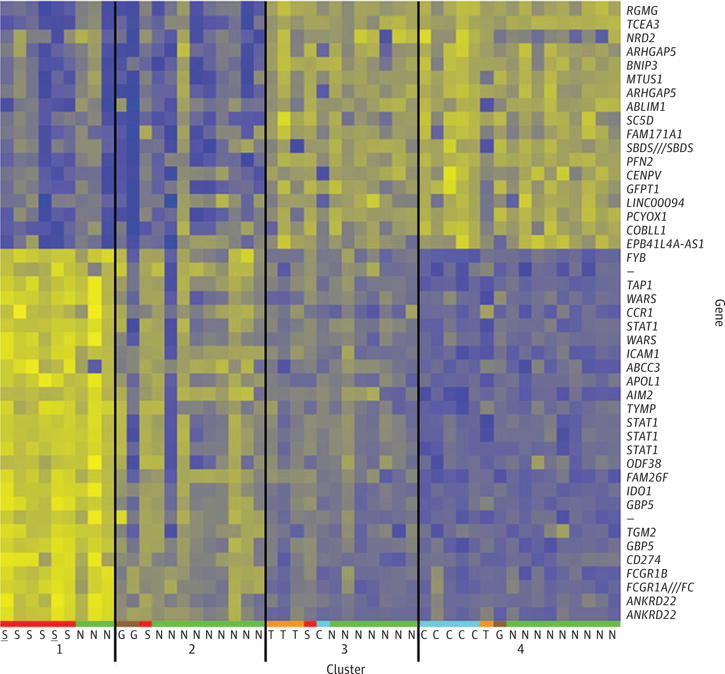
Figure 1.

Heat map showing relative expression levels in 4 clusters based on the core probe sets. Yellow, high expression; blue, low expression; S, sarcoidosis; G, GPA; T, TED; N, NSOI; C, control. The number of clusters and allocation of specimens were determined by the mclust algorithm. The underlined “S”s in cluster 1 indicate two specimens from the same subject.
