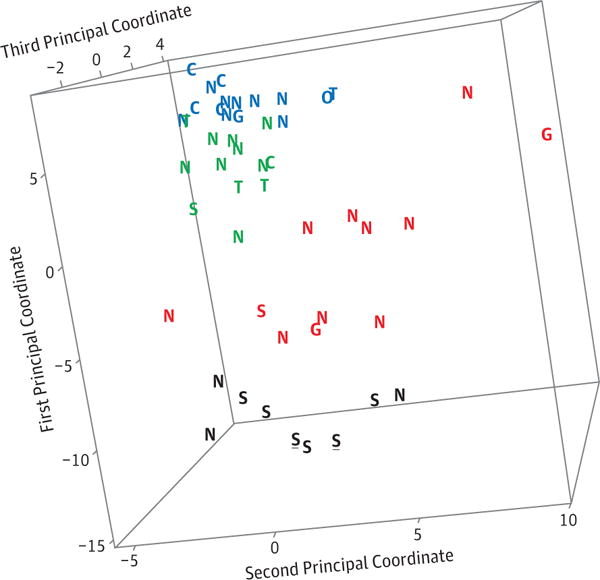
Figure 2.

The 3-dimensional MDS plot illustrates the clustering of the 4 clusters determined by mclust analysis using 45 probe sets previously shown to be differential expressed in subjects with sarcoidosis. The four colors indicate the 4 clusters. A rotating view of this plot is seen in Video 1. S, sarcoidosis; G, GPA; T, TED; N, NSOI; C, control. The underlined black “S”s indicate two specimens from the same subject.
