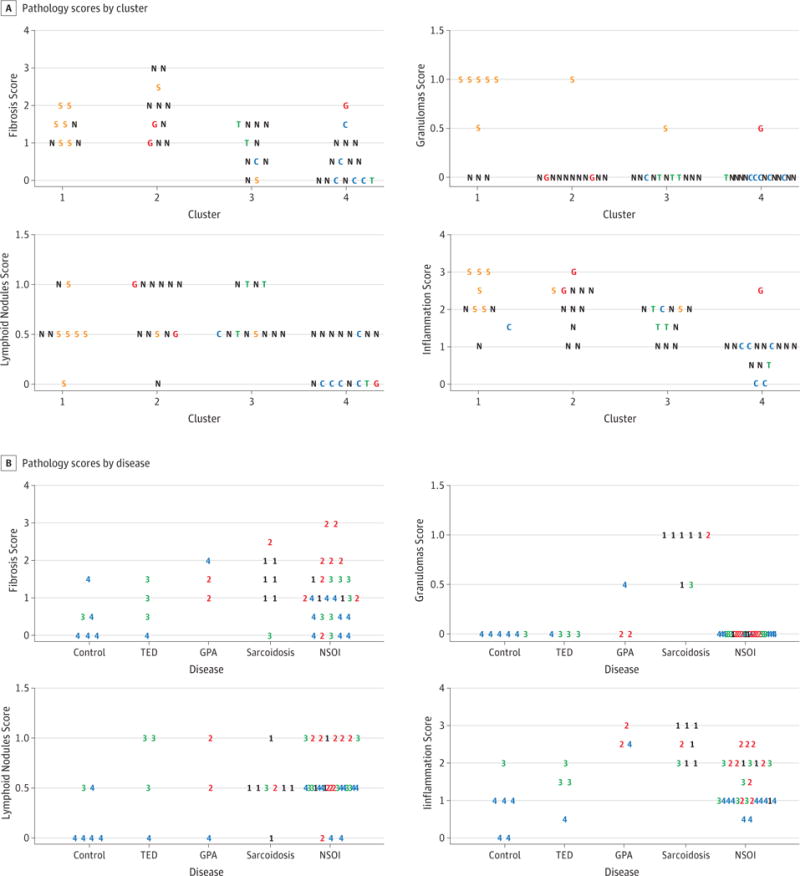
Figure 3.

The tissues were scored for fibrosis, granulomas, lymphoid nodules, and inflammation. A. The scores are grouped by cluster with the letters and colors indicating the disease group. S – sarcoidosis, T – TED, G – GPA, N – NSOI, C – control. B. The scores are grouped by disease with the numbers and colors indicating the clusters as shown in figure 1.
