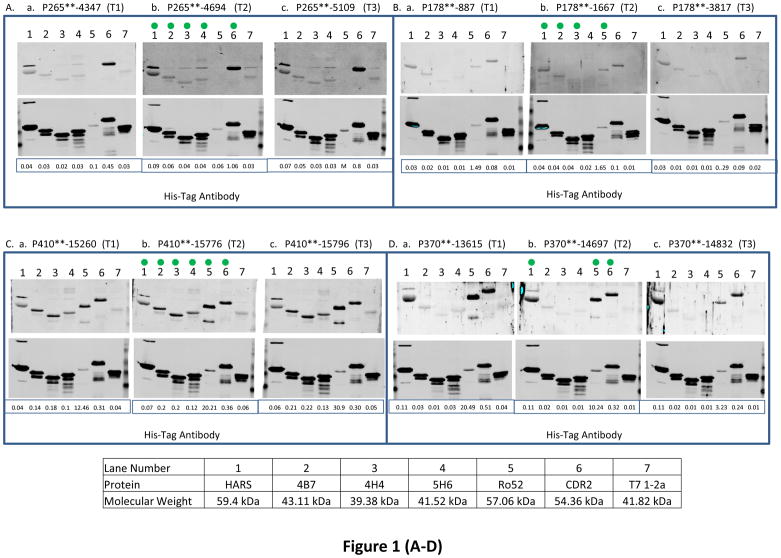
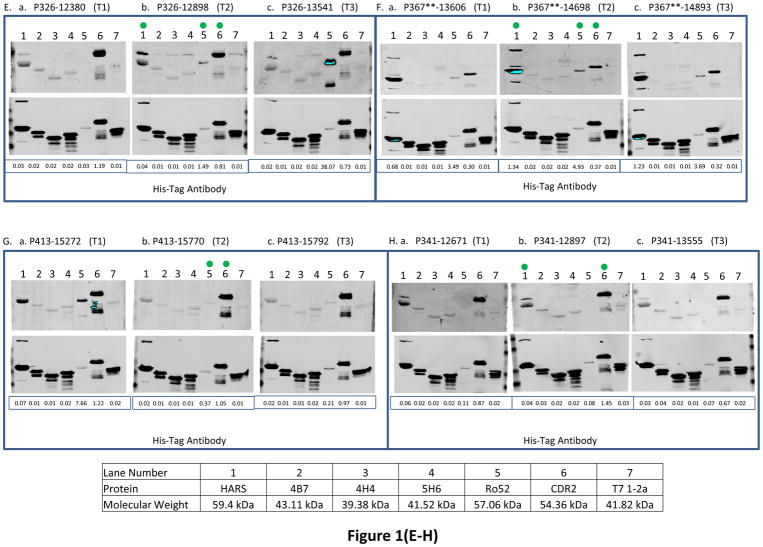
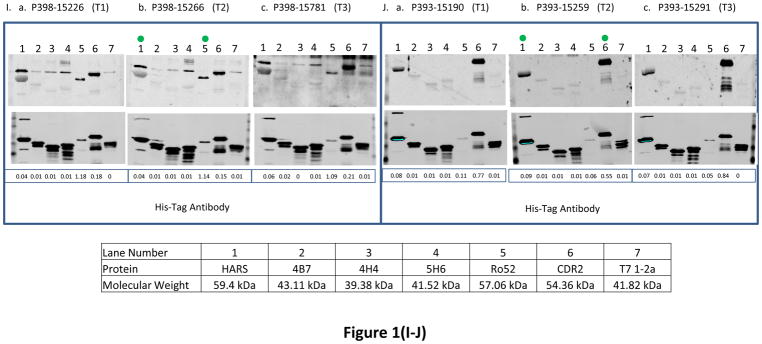
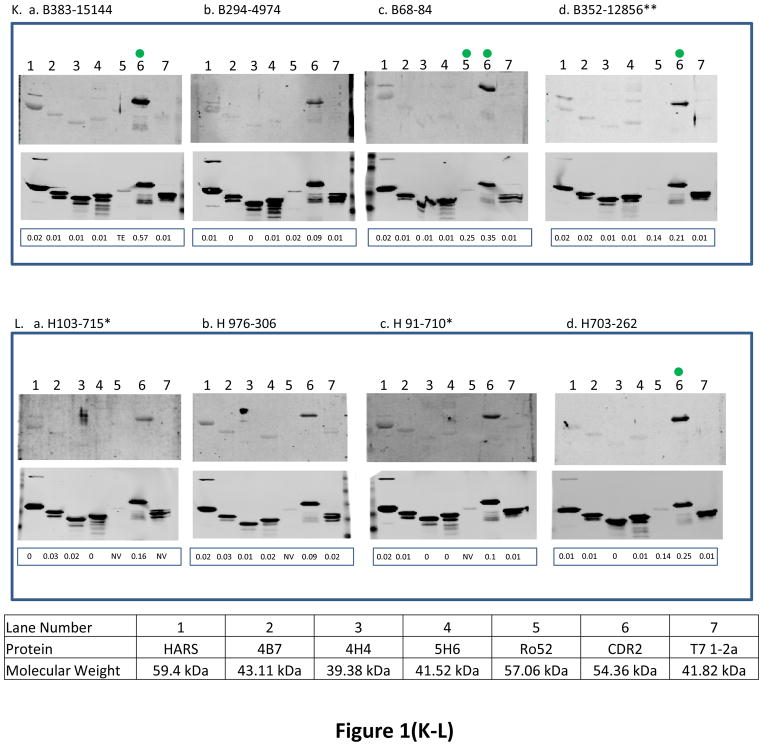
Fig. 1. The reactivity of antigens with serum samples obtained from ovarian cancer patients at 3 different time points and women with other benign diseases and healthy women.
BL21-DE3 bacterial cells bearing individual antigen clone were grown and cell lysate was prepared. One μg of cell lysate for all antigens except Ro52 for which 0.06 μg of protein was loaded and SDS-PAGE followed by transferring protein onto nitrocellulose membrane were performed. The membrane was immunoscreened with patient’s serum IgG (see Material and Methods) and protein band intensity for each protein was quantified using Odyssey software. For patients with double asterisks (**) in panels (A–J), the western blot images were scanned at 6.5 for 800 nm wavelength for better visual purposes but the normalized signal intensity for each antigen listed in those images were obtained from the image scanned at intensity 7.5 for 800 nm wavelength. “M” means missing value for panels (A–J). In each panel, a, b and c represent images of immunoreactivity of antigens with the serum samples obtained from one ovarian cancer patient at different time points (T1: the baseline blood sample collected at time of diagnosis; T2: the blood sample collected approximately 3–15 months before the clinical recurrence, ideally with normal CA125 and no evidence of disease; T3: the sample collected as close as possible to clinical recurrence). In panels (K–L), some samples have (*) beside their names and for those samples images were scanned at intensity 6.5 and quantified data were also obtained from the same images scanned at intensity 6.5 because of technical problems. “TE” means technical error and “NV” means negative value for panels (K–L). Panels (A–J) represent immunoreactivity of antigens with ovarian cancer patients, and panels (K–L) represent immunoreactivity of antigens with benign and healthy women. The green dot on the antigen that is shown on the western blot image at time T2 shows that the normalized signal intensity for that particular antigen is above its cutoff. Underneath each western blot images in a panel, the normalized signal intensity value of each protein band is shown.


