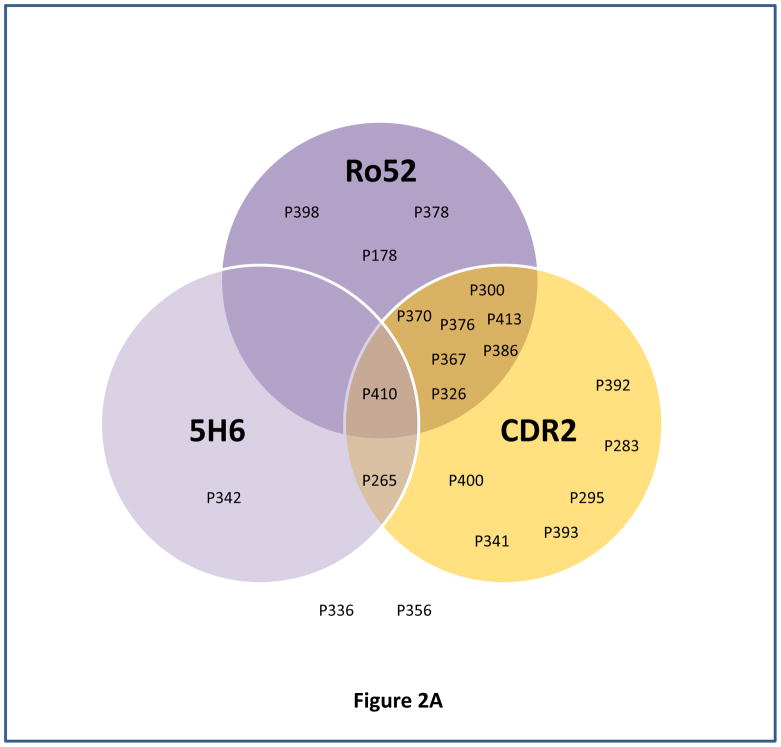
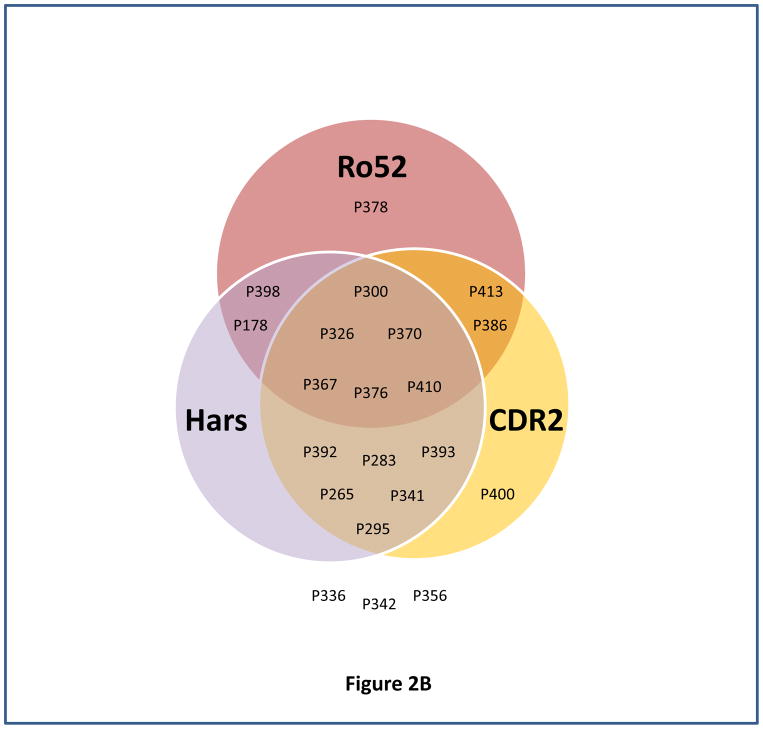
Fig. 2. Determination of sensitivity of different combination of antigens for predicting ovarian cancer recurrence using venn diagram.
Venn diagrams represented the immunoreactivity of each antigen (above its cutoff) with ovarian cancer patient’s serum sample obtained at time T2 (the blood sample collected approximately 3–15 months before the clinical recurrence, ideally with normal CA125 and no evidence of disease). Panels (A–B) represent venn diagram of different combination of antigens, Ro52, CDR2 and 5H6 (A), and Ro52, HARS, and CDR2 (B) used for determining sensitivity for predicting ovarian cancer recurrence.


