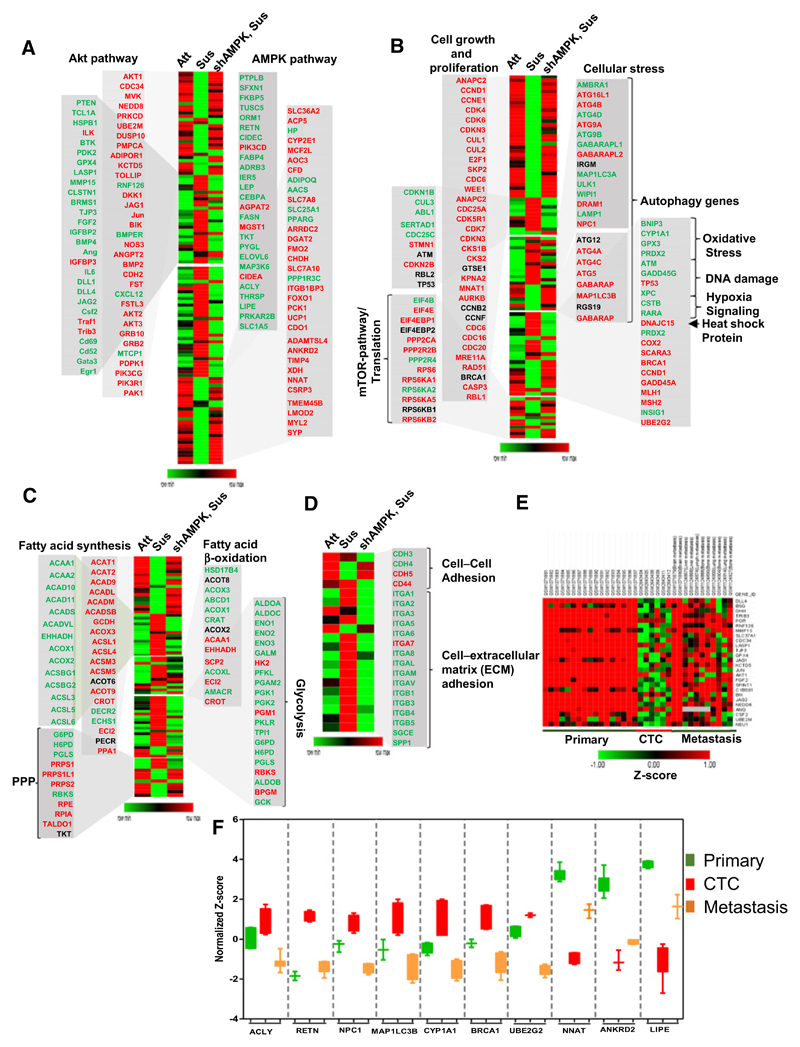
Figure 6.
Microarray-based expression profiling of genes regulated in matrix-attached versus matrix-detached states of cells. A–D, Heat map depicting unsupervised clustering of gene expression profiles from MDA-MB-231 cells cultured in adherent condition (Att), suspension for 24 hours (Sus), and expressing shAMPKα2. Genes of interest are color coded. Red, highly expressed genes; green, downregulated genes. The zoomed section of the heat map represents genes involved in Akt and AMPK pathways (A), cell growth, proliferation, autophagy, and cellular stress conditions (B), metabolic processes (C), and cell–cell and cell–ECM adhesions (D). E, Heat map depicting semisupervised clustering of genes involved in Akt signaling across primary breast tumor, CTCs, and metastases. F, Box plots show distribution of normalized (Z-score) gene expression of AMPK-dependent genes from microarray data available for primary tumor (GSE43837), CTCs (GSE99394), and metastases of breast cancer patients (GSE43837 and GSE56493).

