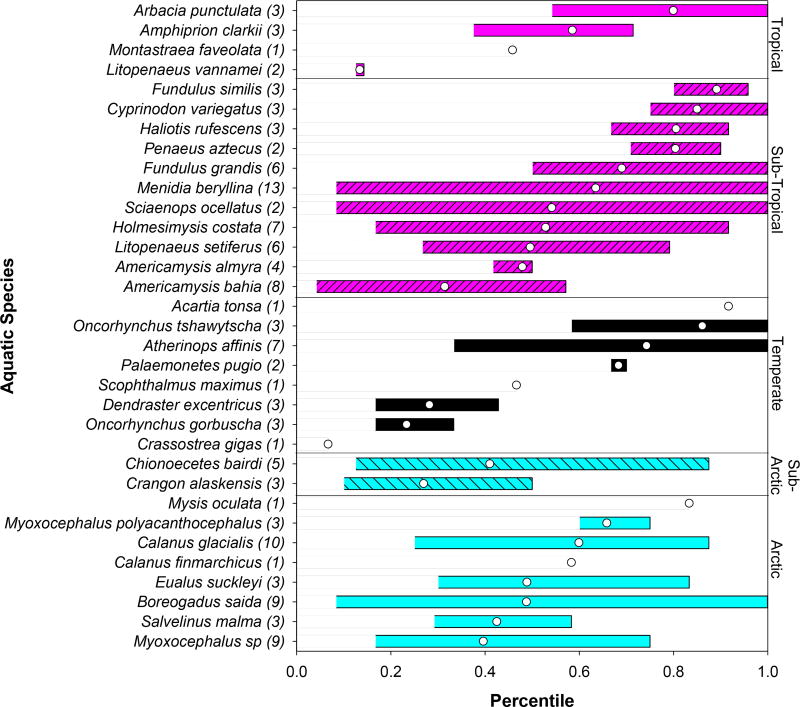
Figure 3.
Range of percentiles occupied by individual species across 13 different SSDs. The extremes of the horizontal bars indicate minimum and maximum percentiles, while the white circle represents the mean percentile. The number in parenthesis indicates the number of SSDs in which individual species were included.

