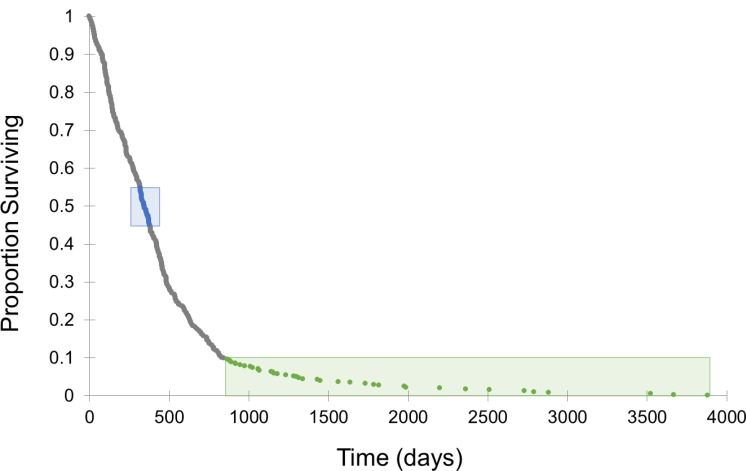
Figure 1. Survival curve for TCGA GBM dataset.
This curve includes the 408 TCGA GBM patients that met the inclusion criteria. The curve is characterized by a steep drop off centered around the median of 345 days, with a relatively small number of patients surviving beyond approximately 2.5 years. Typical responders are labeled in blue and exceptional responders are labeled in green.

