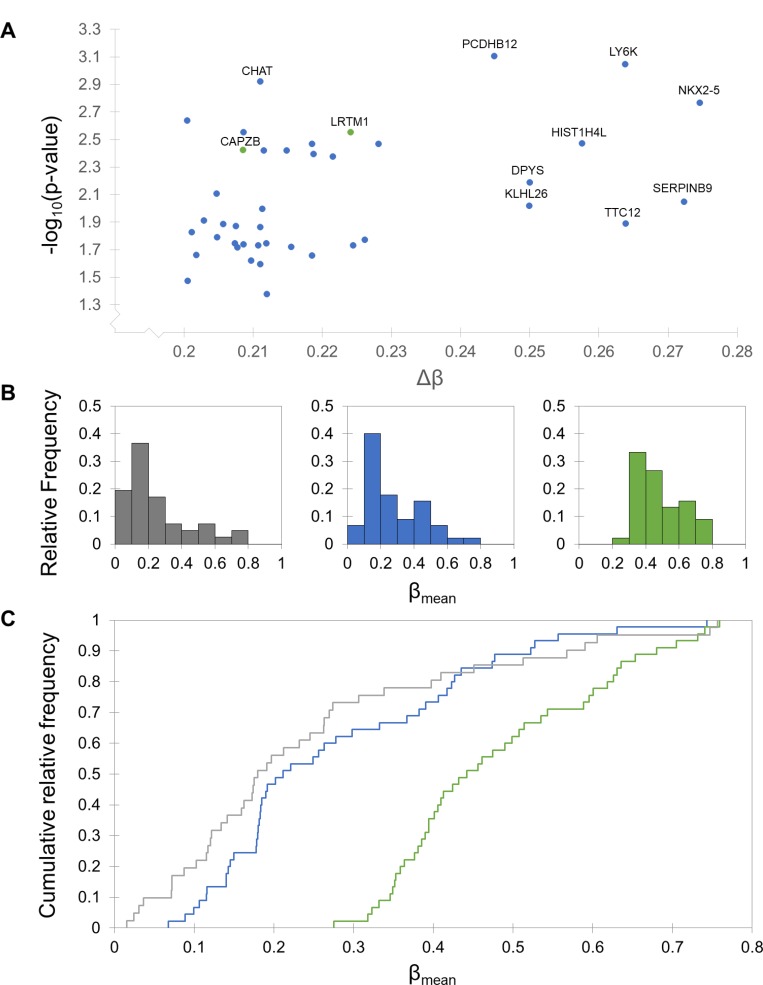
Figure 3. Differential methylation patterns between typical and exceptional responders.
Typical responders are shown in blue, exceptional in green, and normal in grey. (A) Modified volcano plot of significantly differentially methylated CpG sites between typical and exceptional responders. Each axis is skewed to reflect the cutoffs made to assess significance (p > 0.05 and ∆β > 0.2). Sites with a lower degree of methylation in typical responders are shown in blue and sites with a lower degree of methylation in exceptional responders are shown in green. Sites with the largest ∆β values and smallest p values are labeled with their associated gene name. (B) Histograms of β values in normal glial cells and each response group. The response group histograms include mean β values for the 45 CpG sites with ∆β values larger than 0.2, and the normal histogram includes β values for 41 of those sites (the remaining 4 sites were not assessed in the normal arrays). The distribution of β values in typical responders closely resembles the distribution for normal glial cells, while the exceptional responders are characterized by a shift towards larger β values. (C) Kolmogorov-Smirnov (KS) tests and cumulative distribution plots of β values. KS tests indicate that the distribution of β values for the CpG sites with ∆β > 0.2 is significantly different from both the typical and normal distributions (p < 0.0001). There is no difference between the distributions for the typical and normal groups. Cumulative distribution plots are shown for each of the three groups, indicating a clear shift in exceptional responders toward higher β values.

