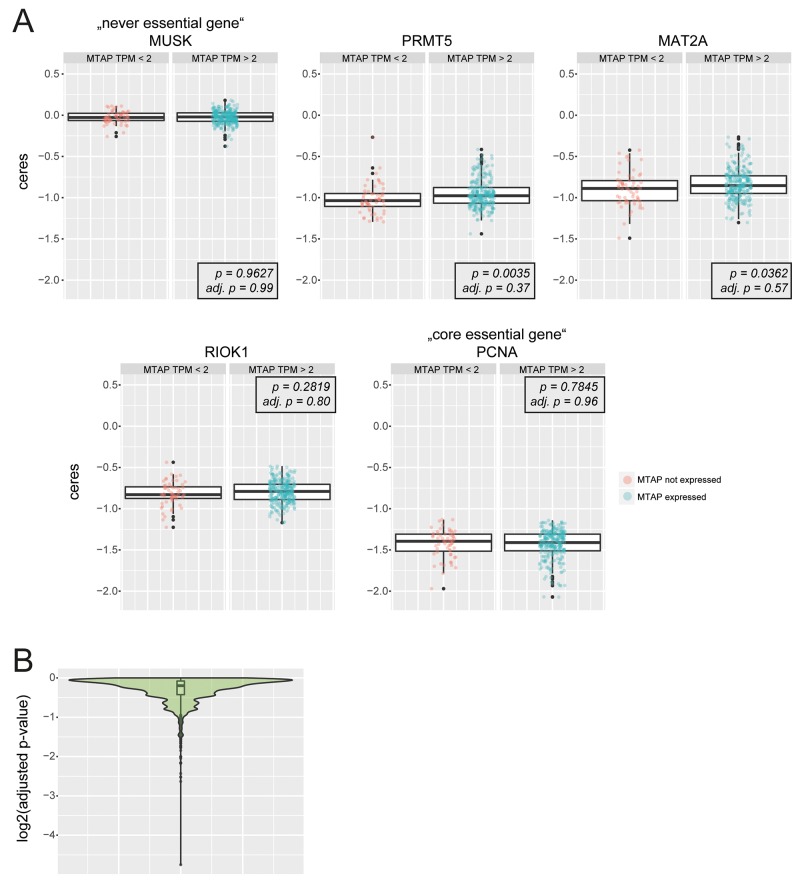
Figure 2. Bio-informatics analysis of publicly available genome-scale CRISPR screening data.
(A) Boxplots (overlaid: individual data points) depict depletion scores between MTAP non-expressing cells (MTAP TPM < 2) and MTAP expressing cells (MTAP TPM > 2) for the “never essential gene” MUSK, PRMT5, MAT2A, RIOK1 and the “core essential gene” PCNA. p-values (p) and adjusted p-values (adj. p) for Wilcoxon test statistics are indicated. Y- axis depicts the ceres scores as reported in [20]. No statistically significant differences between MTAP expressing and non-expressing cells were observed after correcting for multiple testing (adj. p). (B) Explorative analysis for differentially required genes between MTAP expressing and non-expressing cells. Violin- and boxlot of log2 adjusted p-values (Wilcoxon test).

