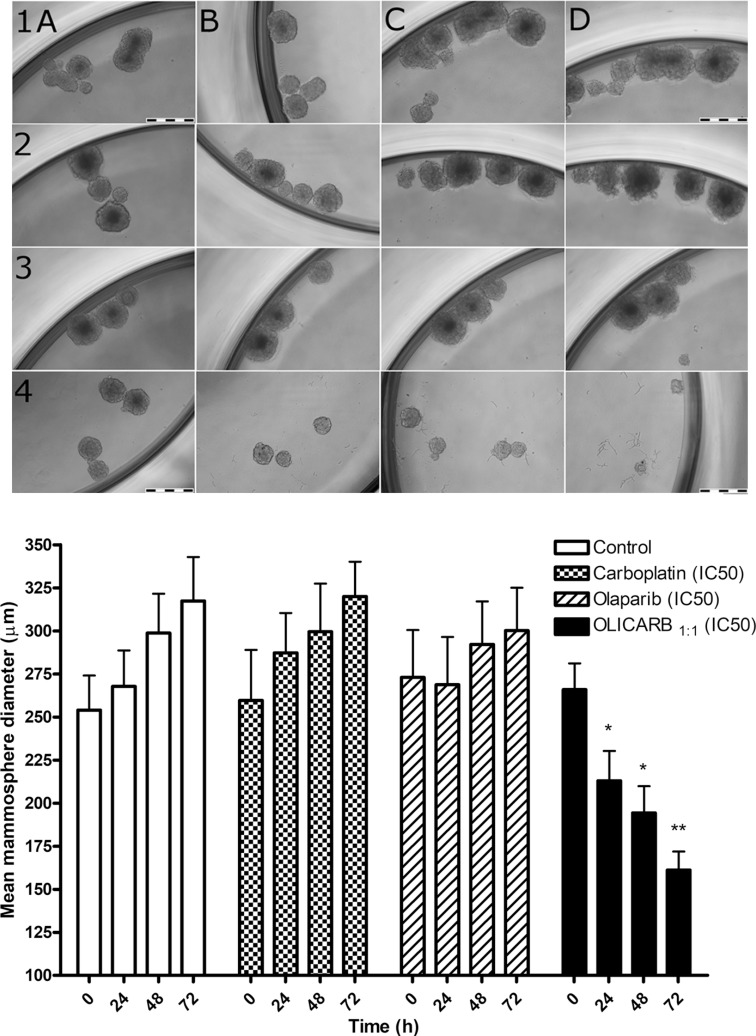
Figure 7. Representative bright-field images of the mammospheres formed with MCF-7 cells untreated and treated with the investigated compounds.
The cells were treated with the investigated compounds at their respective IC50 values [determined for the treatment lasting 72 h (Table 1)] if not stated otherwise. Upper panel: Rows: 1, control, untreated cells; 2–4, the cells treated with carboplatin (2); olaparib (3); OLICARB1:1 (4) for 0 h (column A), 24 h (column B), 48 h (columns C) and 72 h (column D). Cells were seeded in quadruplicate. Scale bars represent 500 μm. Lower panel: Quantification of mammosphere formation with MCF-7 cells untreated and treated with the investigated compounds for 24, 48 and 72 h at their respective IC50 values [determined for the treatment lasting 72 h (Table 1)]. Error bars indicate the SDs, statisticalanalysis was calculated with one-way ANOVA and non-parametric students´ t-tests; the symbols * and ** denote a significant difference (p < 0.05 and p < 0.001, respectively) from the sham treated control. Data are the mean ± SD obtained from at least three different experiments each performed in triplicate.

