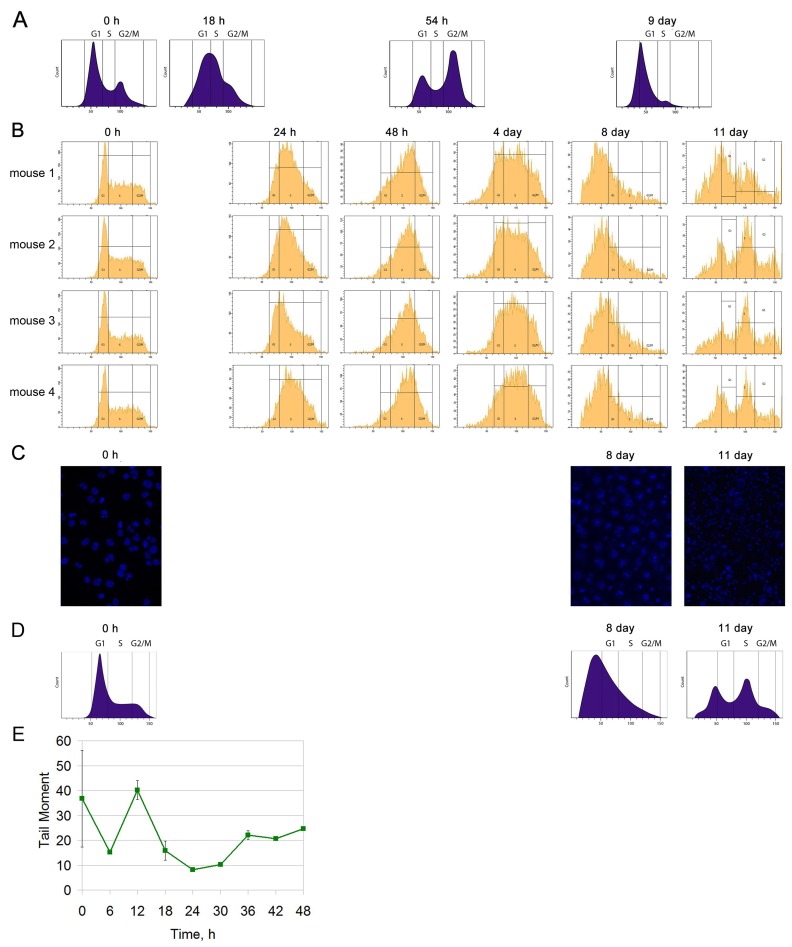
Figure 4. Cell cycle analysis of Krebs-2 ascites.
(A) Schematic results according to [5]. (B) Cell cycle analysis of Krebs-2 ascites for 4 mice after three-fold treatment with the CP cytostatic (100 mg/kg) at 36 hour intervals. (C) Visual condition of Krebs-2 ascites cells (DAPI) after three-fold CP injections. (D) A schematic of the results from (B). (E) The repair cycle of ascites cells; the mean values and standard deviations are given for 3 mice.

