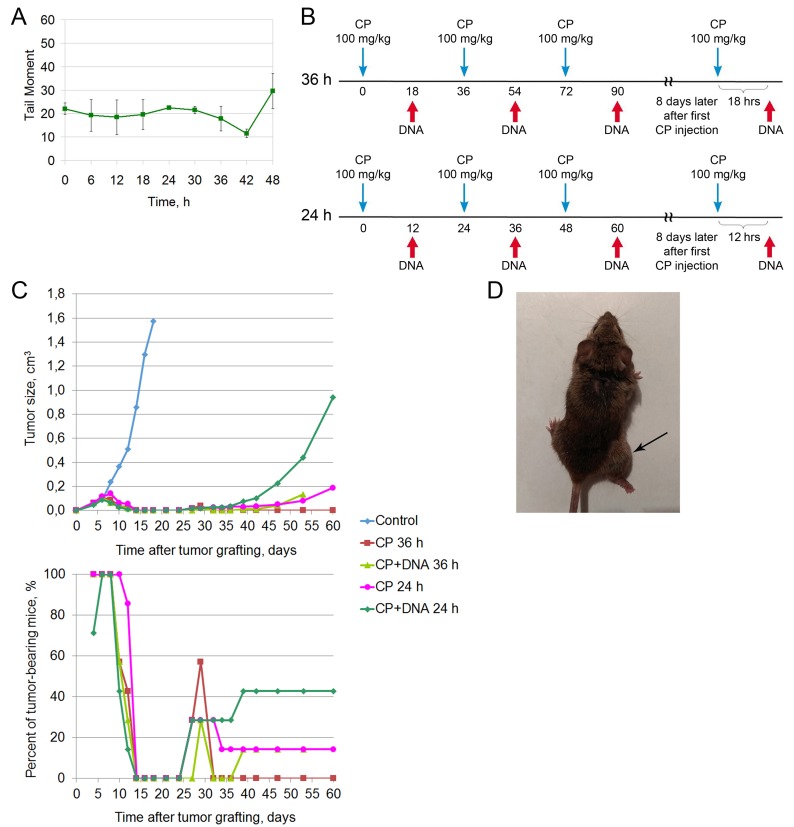
Figure 5. Treatment of a Krebs-2 solid tumor (spring 2017).
(A) The repair cycle of ascites cells; the mean values and standard deviations are given for 2 mice. (B) A schedule of injections for 36 and 24 hour intervals of CP administration. (C) Dynamics of changes in the tumor size, number of animals with tumor, and number of surviving mice. Data for the following animal groups treated according to the schedule (B) are shown: control, untreated; CP 36h and CP 24h, CP injections at 36 or 24h intervals; CP+DNA 36h and 24 h, co-injections of CP and DNA preparation at 36 or 24 h intervals. (D) Image of a mouse from the CP 36 h group, which relapsed on day 85 after inoculation.

