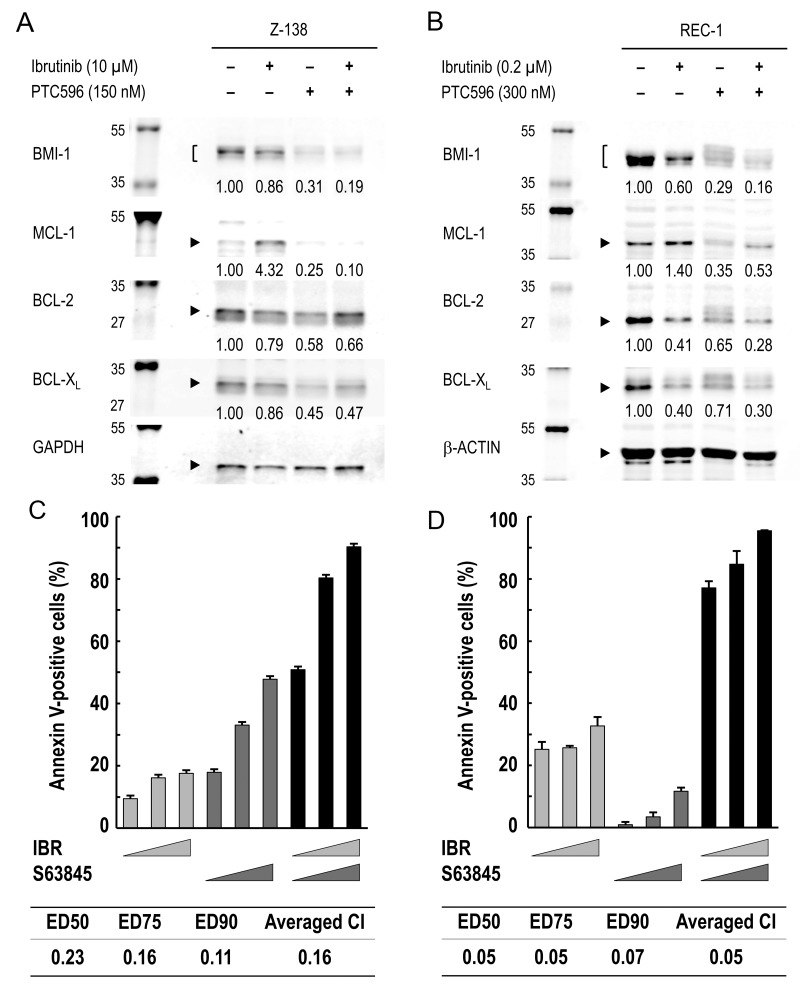
Figure 5. MCL-1 reduction by PTC596 counteracts ibrutinib-induced increase in MCL-1 expression and MCL-1 blockade augments ibrutinib-induced apoptosis.
(A) Z-138 cells were treated for 48 hours with 10 μM ibrutinib (IBR) and 150 nM PTC596 either as individual agents or in combination, after which BCL-2, BCL-XL and MCL-1 protein levels were determined. (B) REC-1 cells were treated with IBR (0.2 μM, 96 hours) and PTC596 (300 nM, 24 hours) either as individual agents or in combination, after which BCL-2, BCL-XL and MCL-1 protein levels were determined. PTC596 was added 72 hours after IBR exposure. (C) Z-138 cells were treated for 72 hours with IBR (2.5, 5 or 10 μM) and the selective MCL-1 inhibitor S63845 (100, 200 or 400 nM), either as individual agents or in combination, after which the annexin V-positive fractions were determined. (D) REC-1 cells were treated with IBR (0.05, 0.1 or 0.2 μM for 96 hours) and S63845 (50, 100 or 200 nM for 24 hours) either as individual agents or in combination, after which the annexin V-positive fractions were determined. The results are expressed as the mean ± SD.

