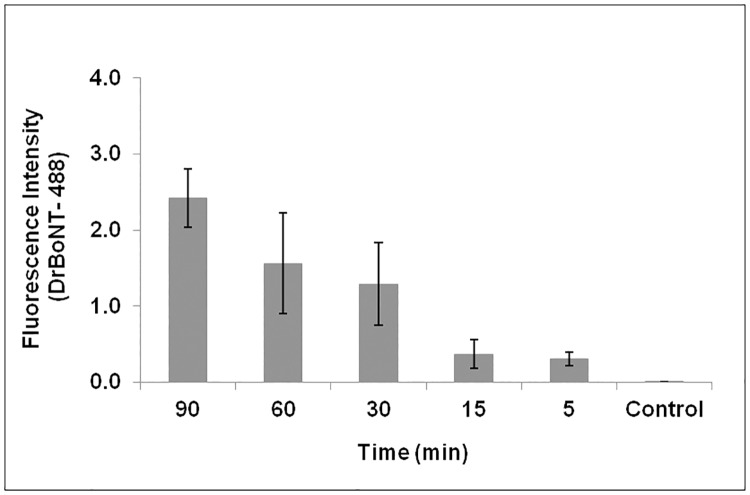
Fig 9. Comparison of DrBoNT internalization in the presence of Hn33 at various time points.
The mean fluorescence intensities of cells for each treatment were measured and the background subtracted. The results were the average of five cells ± standard deviation. Statistical analysis performed using a one-way ANOVA showed that the data was statistically significant (ρ<0.05).

