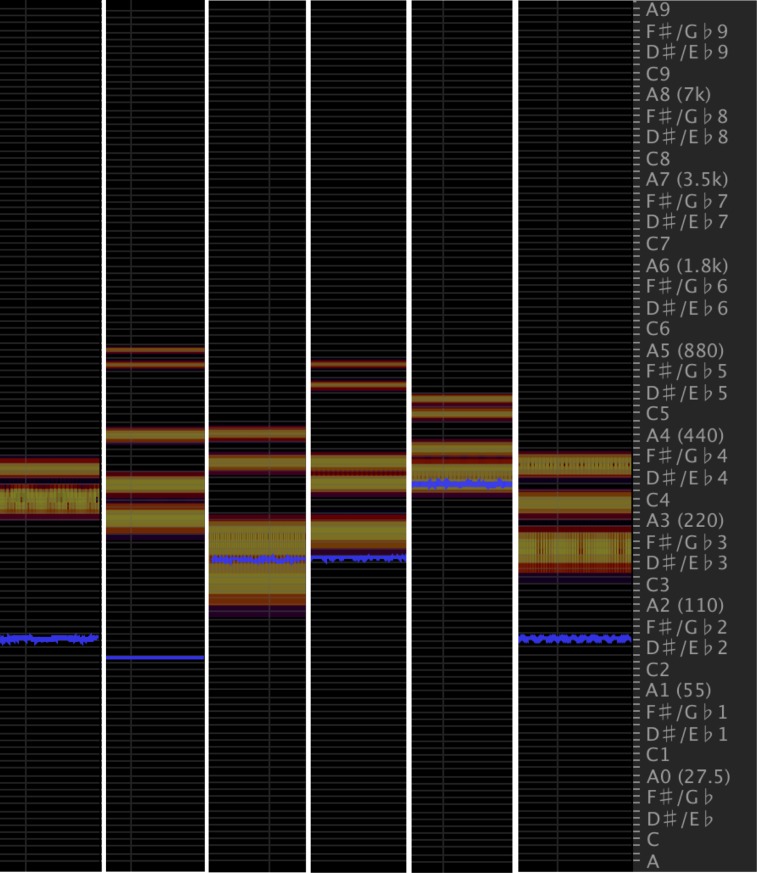
Fig 3. Spectral frequency displays of the additive sinusoidal hums used in the distance-dependent hum volume modulation sonification method.
Each column (horizontal axis) corresponds to a hum, with its frequency components/notes shown on the vertical axis. The blue band indicates the hum’s core frequency, while the red and orange bands indicate other prominent frequencies.

