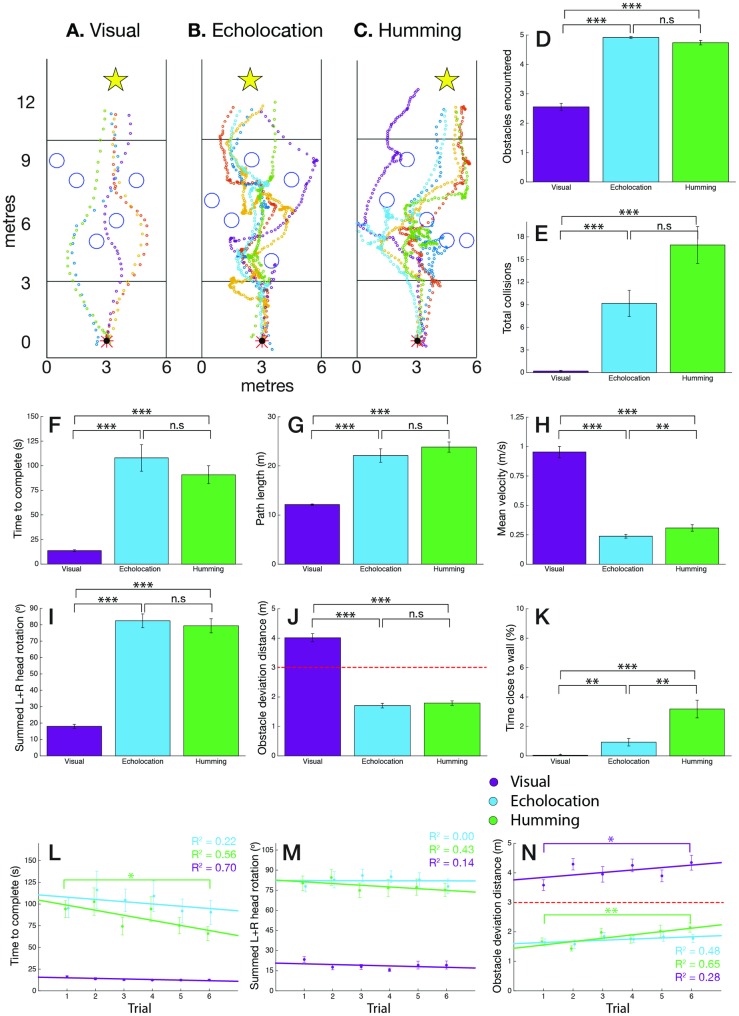
Fig 5. Obstacle corridor navigational behaviours and results.
(A, B, & C) Examples of participant trajectories through particular obstacle corridor arrangements using visual-only cues (A), echolocation audio-only cues (B), and humming audio-only cues (C). (D, J, & K) Active interaction with obstacles in the corridor in the visual (purple), echolocation (blue) and humming (green) conditions: number of obstacles encountered at least once per trial (D), obstacle deviation distance (J), and percentage of obstacle patch time per trial spent <0.4m from left or right wall (K). Red dashed line shows 3m echolocation and humming threshold. Error bars indicate standard error. Statistical significance indicated as follows: not significant (n.s.), p < .05(*), p < .01(**) and p < .001(***). (E, F, G, & H) Basic efficiency of navigation through the obstacle corridor in the visual (purple), echolocation (blue) and humming (green) conditions: total number of collisions over 6 trials per participant (E), time to reach goal in seconds (F), path length in metres (G), mean velocity in metres per second (H). Error bars indicate standard error. Statistical significance indicated as follows: not significant (n.s.), p < .05(*), p < .01(**) and p < .001(***). (I) Summed left and right head rotation from head straight (0°) direction in the corridor in the visual (purple), echolocation (blue) and humming (green) conditions. Error bars indicate standard error. Statistical significance indicated as follows: not significant (n.s.), p < .05(*), p < .01(**) and p < .001(***). (L, M, & N) Learning curves over 6 trials comparing visual (purple), echolocation (blue) and humming (green) conditions in the obstacle corridor: time to complete in seconds (L), summed left and right head rotation in degrees (M), obstacle deviation distance in metres (N). Red dashed line shows 3m echolocation and humming threshold. Linear regression line with R2-statistic shown for each condition in corresponding colours. Error bars indicate standard error. Significance symbols mark significance of effect between first and sixth trial. Statistical significance indicated as follows: not significant (not shown), p < .05(*), p < .01(**) and p < .001(***).

