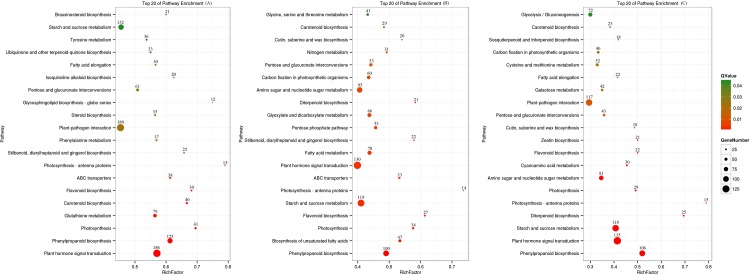
Fig 5. Top 20 pathways enriched among various tissues of B. cusia.
(A) The top 20 pathways enriched between root and leaf; (B) the top 20 pathways enriched between root and stem; (C) the top 20 pathways enriched between stem and leaf. The top 20 pathways enriched from top to bottom are arranged by decreasing Q-value. Data over the dots show the actual gene number.

