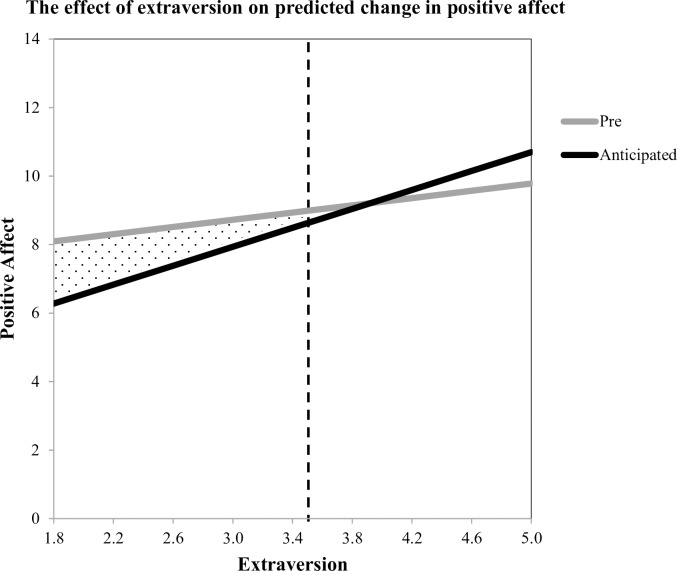
Fig 3. The relationship between (1) extraversion and baseline positive affect and (2) extraversion and what participants predicted their positive affect would be after socializing.
The gray zone shows the region in which anticipated positive affect is significantly different from pre-positive affect. Participants who are more introverted (< 3.53, 55% of sample; M = 3.51 for population) expected to experience a decrease in positive affect after socializing with others. Those who are more extraverted did not predict a significant change in positive affect.

